The Apple A15 SoC Performance Review: Faster & More Efficient
by Andrei Frumusanu on October 4, 2021 9:30 AM EST- Posted in
- Mobile
- Apple
- Smartphones
- Apple A15
CPU ST Performance: Faster & More Efficient
Starting off with this year’s review of the A15, in order to have a deeper look at the CPU single-threaded performance and power efficiency, we’re migrating over to SPEC CPU 2017. While 2006 has served us well over the years and is still important and valid, 2017 is now better understood in terms of its microarchitectural aspects in its components, and becoming more relevant as we moved our desktop side coverage to the new suite some time ago.
One continuing issue with SPEC CPU 2017 is the Fortran subtests; due to a lacking compiler infrastructure both on iOS and Android, we’re skipping these components entirely for mobile devices. What this means also, is that the total aggregate scores presented here are not comparable to the full suite scores on other platforms, denoted by the (C/C++) subscript in the score descriptions.
As always, because we’re running completely custom harnesses and not submitting the scores officially to SPEC, we have to denote the results as “estimates”, although we have high confidence in the accuracy.
In terms of compiler settings, we’re continuing to employ simple -Ofast flags without further changes, to be able to get the best cross-platform comparisons possible. On the iOS side of things, we’re running on the newest XCode 13 build tools, while on Android we’re running the NDKr23 build tools.
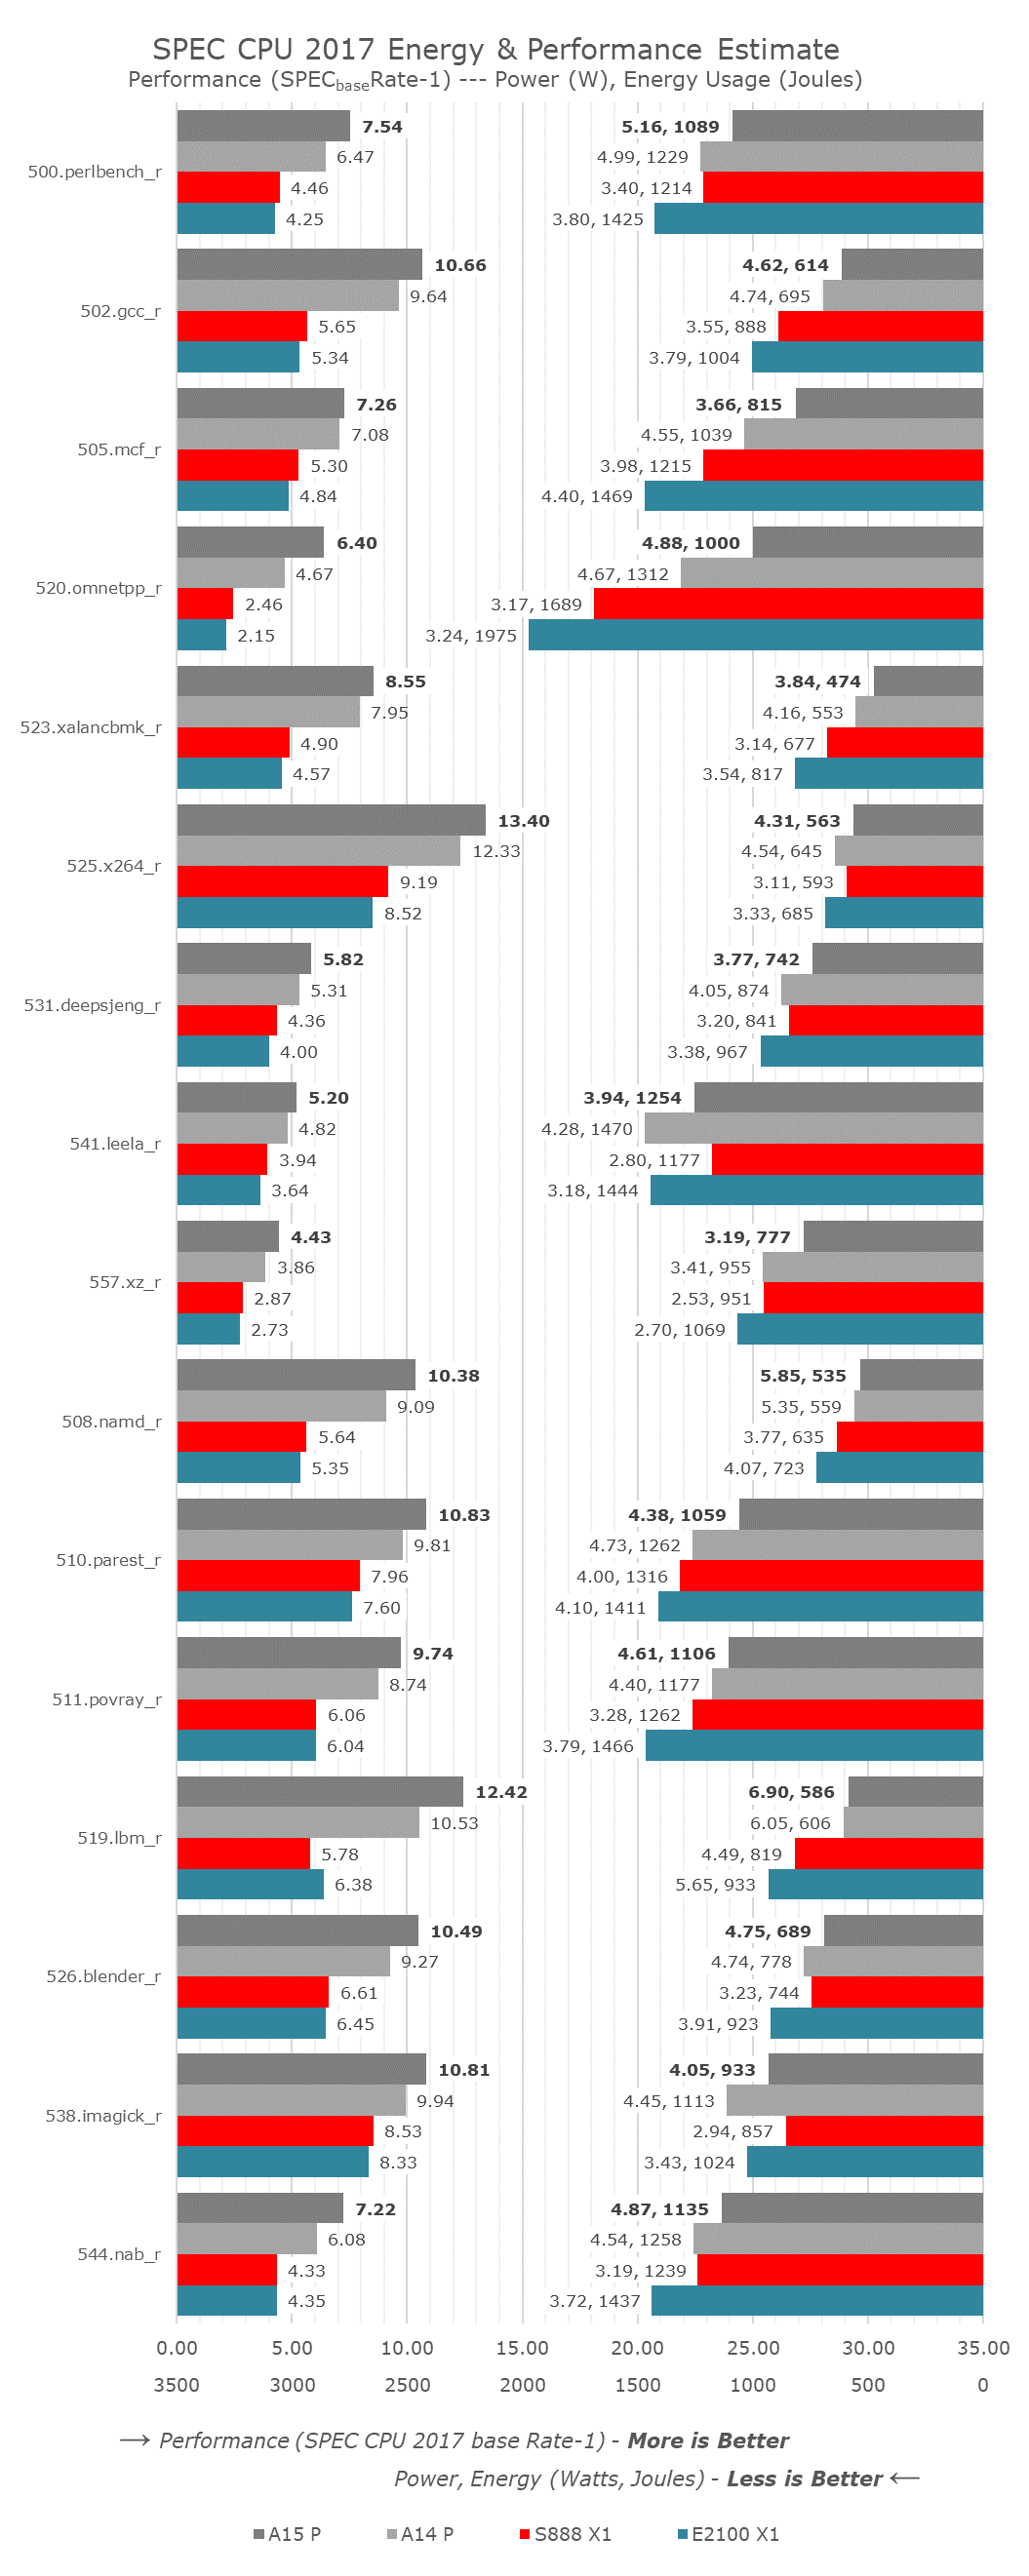
In terms of performance and efficiency details, we’re swapping the graphs around a bit from now on – on the left axis we have the performance scores of the tests – larger bars here mean better performance. On the right-side axis, growing from right to left are the energy consumption figures for the platforms, the smaller the figure, the more energy efficient (less energy consumed) a workload was completed. Alongside the energy figure in Joules, we’re also showcasing the average power figure in Watts.
Starting off with the performance figures of the A15, we’re seeing increases across the board, with absolute performance going up from a low of 2.5% to a peak of +37%.
The lowest performance increases were found in 505.mcf_r, a more memory latency sensitive workload; given the increased L2 latency as well as slightly higher DRAM latency, it doesn’t come too unexpected to see a more minor performance increase. However, when looking at the power and efficiency metrics of the same workload, we see the A15 use up almost 900mW less than the A14, with energy efficiency improving by +22%. 520.omnetpp_r saw the biggest individual increase at +37% performance – power here went up a bit, but energy efficiency is also up 24%.
The smallest performance gains of the A15 are found in the most back-end execution bound workloads, 525.x264_r and 538.imagick_r improve by only 8.7%, resulting in an IPC increase of 0.6% - essentially within the realm of measurement noise. Still, even here in this worst performance case, Apple still managed to improve energy efficiency by +13%, as the new chip is using less absolute power even though clock frequencies have gone up.
The most power demanding workload, 519.lbm_r, is extremely bandwidth hungry and stresses the DRAM the most in the suite, with the A15 chip here eating a whopping 6.9W of power. Still, energy efficiency is generationally slightly improved as performance goes up by 17.9% - based on first teardown reports, the A15 is still only powered by LPDDR4X-class memory, so these improvements must be due to the chip’s new memory subsystem and new SLC.
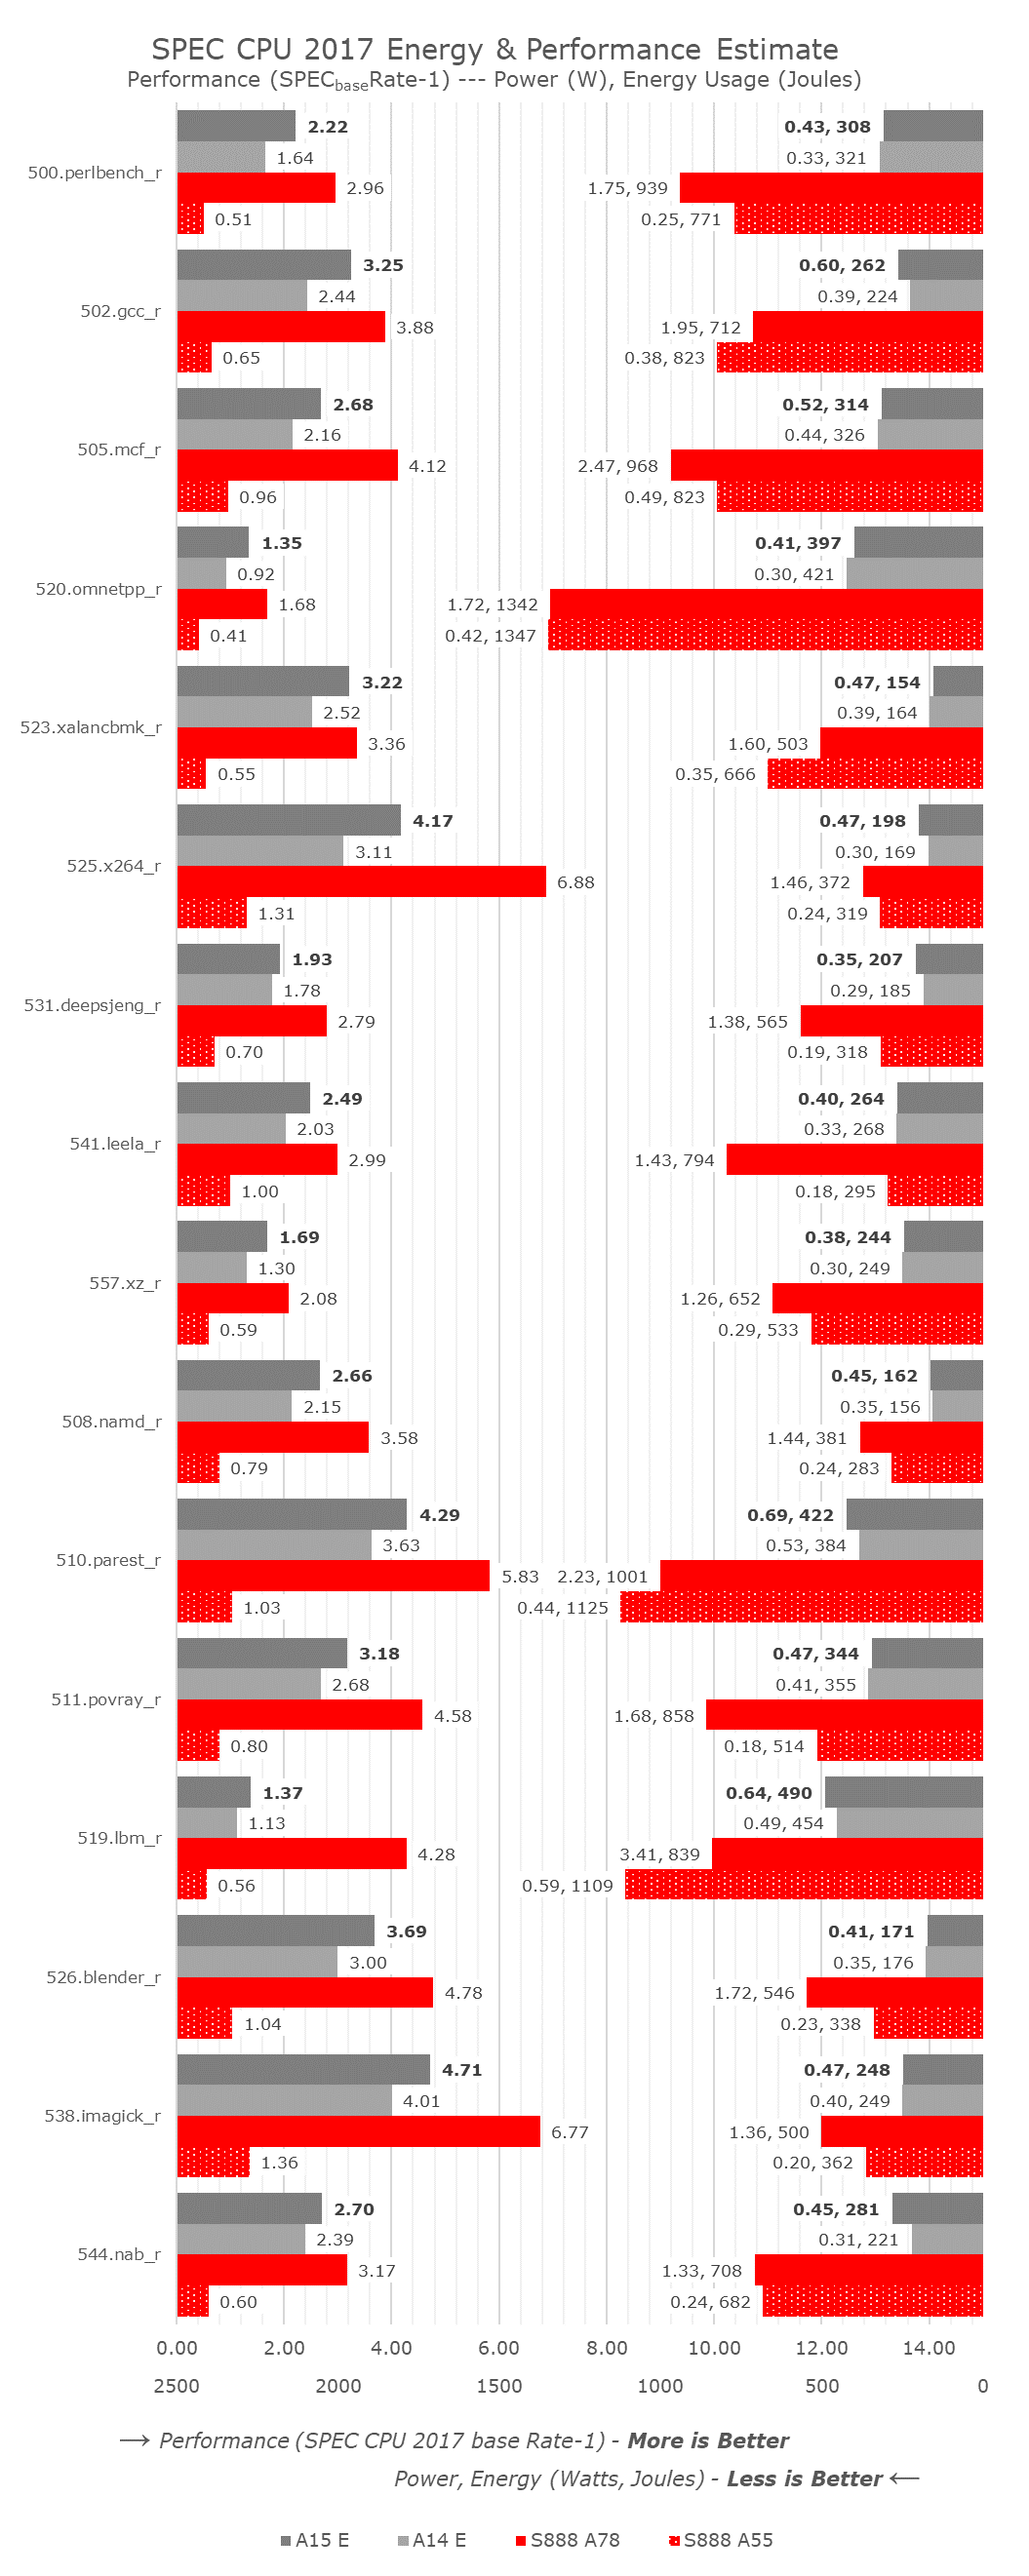
Shifting things over to the efficiency cores, I wanted to make comparisons not only to the A14’s E-cores, but also put the Apple chips in context to the competition, a Snapdragon 888 in this context, comparing against a 2.41GHz Cortex-A78 mid-core, as well as a 1.8GHz Cortex-A55 little core.
The A15’s E-cores are extremely impressive when it comes to performance. The minimum improvement varies from +8.4 in the 531.deepsjeng_r, essentially flat up with clocks, to up to again +46% in 520.omnetpp_r, putting more evidence into some sort of large effective sparse memory access parallelism improvement for the chip. The core has a median performance improvement of +23%, resulting in a median IPC increase of +11.6%. The cores here don’t showcase the same energy efficiency improvement as the new A15’s performance cores, as energy consumption is mostly flat due to performance increases coming at a cost of power increases, which are still very much low.
Compared to the Snapdragon 888, there’s quite a stark juxtaposition. First of all, Apple’s E-cores, although not quite as powerful as a middle core on Android SoCs, is still quite respectable and does somewhat come close to at least view them in a similar performance class. The comparison against the little Cortex-A55 cores is more absurd though, as the A15’s E-core is 3.5x faster on average, yet only consuming 32% more power, so energy efficiency is 60% better. Even for the middle cores, if we possibly were to down-clock them to match the A15’s E-core’s performance, the energy efficiency is multiple factors off what Apple is achieving.
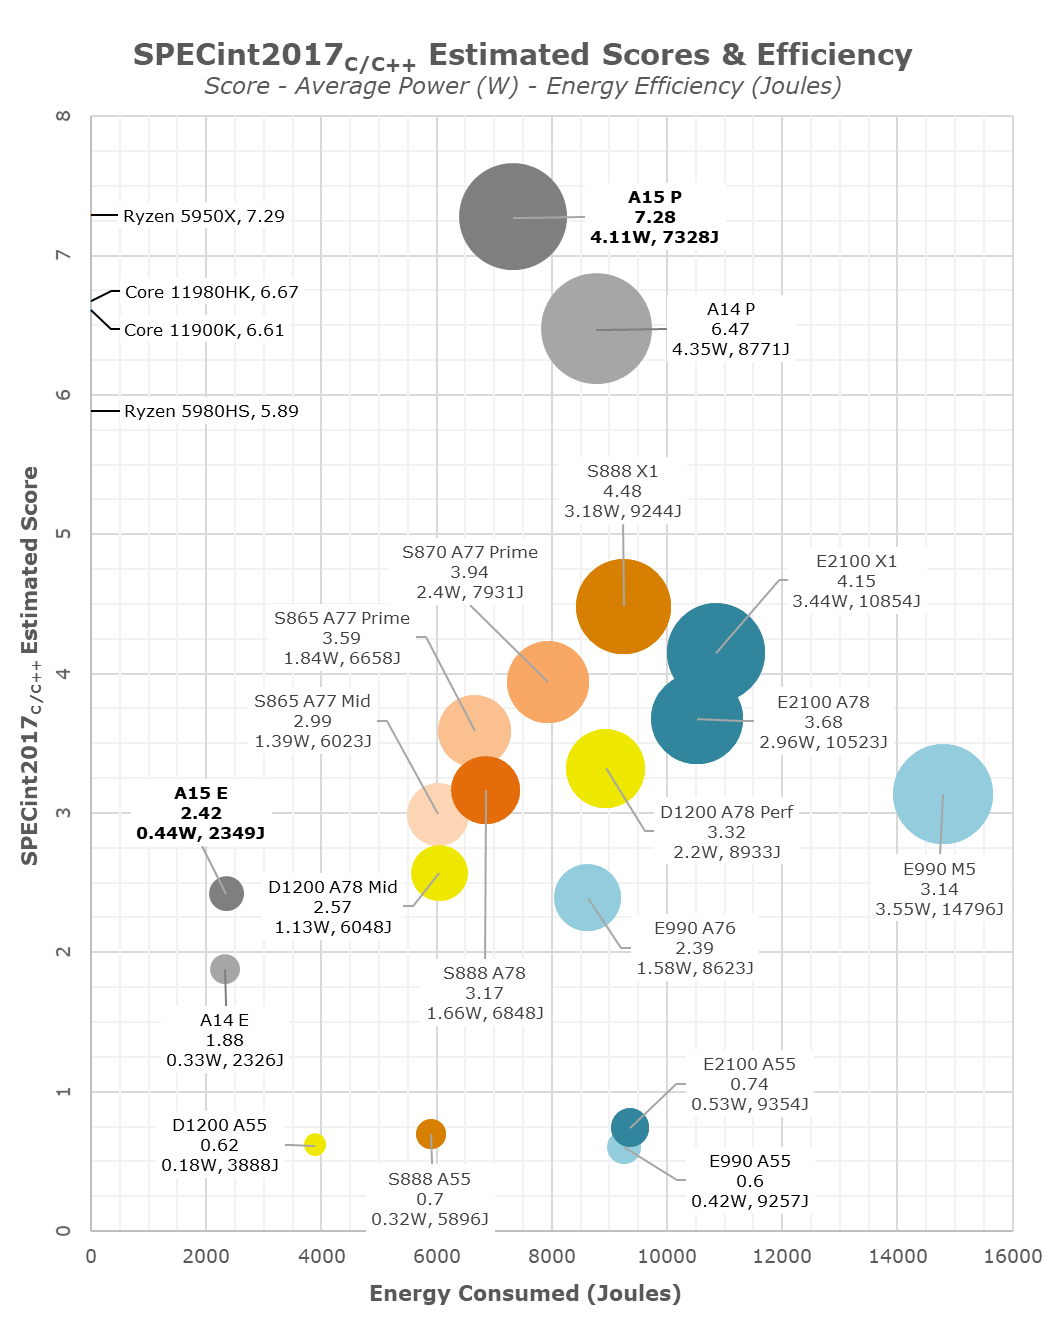
In the overview graph, I’m also changing things a bit, and moving to bubble charts to better spatially represent the performance to energy efficiency positioning, as well as the performance to power positioning. In the energy axis graphs, which I personally find to be more representative of the comparative efficiency and resulting battery life experiences of the SoCs, we see the various SoCs at their peak CPU performance states versus the total energy consumed to complete the workloads. On the power axis graphs, we see the same data, only plotted against average power. Generally, I find distinction of efficiency here to be quite harder between the various data-points, however some readers have requested this view. The bubble size corresponds to the average power of the various CPUs, we’re measuring system active power, meaning total device workload power minus idle power, to compensate components such as the display.
Apple A15 performance cores are extremely impressive here – usually increases in performance always come with some sort of deficit in efficiency, or at least flat efficiency. Apple here instead has managed to reduce power whilst increasing performance, meaning energy efficiency is improved by 17% on the peak performance states versus the A14. If we had been able to measure both SoCs at the same performance level, this efficiency advantage of the A15 would grow even larger. In our initial coverage of Apple’s announcement, we theorised that the company might possibly invested into energy efficiency rather than performance increases this year, and I’m glad to see that seemingly this is exactly what has happened, explaining some of the more conservative (at least for Apple) performance improvements.
On an adjacent note, with a score of 7.28 in the integer suite, Apple’s A15 P-core is on equal footing with AMD’s Zen3-based Ryzen 5950X with a score of 7.29, and ahead of M1 with a score of 6.66.
The A15’s efficiency cores are also massively impressive – at peak performance, efficiency is flat, but they’re also +28% faster. Again, if we would be able to compare both SoCs at the same performance level, the efficiency advantage of the A15’s E-cores would be very obvious. The much better performance of the E-cores also massively helps avoiding the P-cores, further improving energy efficiency of the SoC.
Compared to the competition, the A15 isn’t +50 faster as Apple claims, but rather +62% faster. While Apple’s larger cores are more power hungry, they’re still a lot more energy efficient. Granted, we are seeing a process node disparity in favour of Apple. The performance and efficiency of the A15 E-cores also put to shame the rest of the pack. The extremely competent performance of the 4 efficiency cores alongside the leading performance of the 2 big cores explain the significantly better multi-threaded performance than the 1+3+4 setups of the competition.
Overall, the new A15 CPUs are substantial improvements, even though that’s not immediately noticeable to some. The efficiency gains are likely key to the new vastly longer battery longevity of the iPhone 13 series phones – more on that in a dedicated piece in a few days, and in our full device review.


204 Comments
View All Comments
Ppietra - Wednesday, October 6, 2021 - link
michael2k,process node differences cannot account for the degree of difference in efficiency. N6 to N5P would account for less than 30% reduction in power at the same clock speed (using same design).
What we observe is a 60% reduction in energy vs the D1200 while achieving almost the same performance at a lower clock speed. Apple’s design has a better IPC while consuming much less. Even if we were to compensate for process node advantage we would still have around 40% reduction in energy consumption.
Anyway, Andrei has mentioned that these power consumption values are also affected by other things, not just the CPU cores, so clearly Apple is doing a better job at keeping power under control.
Fulljack - Thursday, October 7, 2021 - link
Snapdragon 888 are fabricated on Samsung 5nm LPE and NOT TSMC N5 (5nm)erinadreno - Monday, October 4, 2021 - link
Not exactly a fan of Apple's design choice of mobile phone SoC. Yes the performance is good, but no integrated modem, hence larger PCB and/or smaller battery. They basically trade area with performance. Due to the lack of peripherals and smaller screen, it's difficult to utilize the full potential while still burning the energy.The same design philosophy (M1) is a lot better on tablet and laptop where performance is less likely to be wasted.
melgross - Monday, October 4, 2021 - link
That’s not an Apple design choice. That’s a Qualcomm limitation. Qualcomm won’t allow Apple (or anyone else) to integrate their modems on a chip not made by Qualcomm. Nevertheless, Apple’s overall phone designs are still more efficient.michael2k - Monday, October 4, 2021 - link
1) That's like complaining about Intel's lack of integrated NVIDIA GPU2) They increased the battery size year over year, so that claim is false
3) They aren't trading area with performance, as indicated by their sandwich PCB, they're trading heat dissipation for reduced performance; the heat dissipation of the CPU + GPU is what limits the performance, but that also probably also helps with increased battery life too
4) Peripherals? WTF are you talking about
5) Smaller screen? WTF? 5.4", 6.1", and 6.7" aren't generally smaller screens, especially when their performance is unrivaled, their battery life is good, and their energy efficiency is some of the best out there
It's like you commented without even reading the article!
erinadreno - Tuesday, October 5, 2021 - link
They increased battery size year over year, yet still beat by pretty much any other smartphone. The area means ASIC area and package size, Apple could step back their design with smaller die size and lower performance, like 1+3 CPU and 3 cluster GPU config for mobile. The sandwich PCB is the indication of trading area with performance. They just circumvent the area problem by having thermal issue. Peripherals are the hardware/software platform around the processor, OS, IO devices, etc. iPhone pretty much lack any real application (not apps) where this much processing power is needed, other than playing games for 5 minutes. I'd agree 6.7" is a large screen, but the other two are definitely small in today's market.jospoortvliet - Tuesday, October 5, 2021 - link
How are they beat by almost every other phone? Their battery life is in the absolute top. Sure they achieve that with a smaller battery and thus lower weight and size - to the benefit of their customers - but hey, that's what it means to be perf per watt leader.markiz - Friday, October 15, 2021 - link
Meh. iPhone never had good battery life. In fact, it was terrible for many years. And they had slow charging. Still do.That said, Galaxy S line also had until S21 poor battery life, about the same.
But there are numerous other high/er end phones that fare much better. I guess in USA only iphone and galaxy matter so you look at it differently.
It was also heavier slightly.
e.g. iphone 11 194g, S20 163
So there was no benefit to the customer in these regards.
cha0z_ - Tuesday, October 5, 2021 - link
my 11 pro max already sh*ts on all top current android phones and 13 pro max sh*ts on my phone on top of all top current gen android phones. They do it with smaller battery? This is not a bad thing, will let you guess why by yourself.markiz - Friday, October 15, 2021 - link
Iphone 13 has worse battery life then S21.pro max 13 has slight advantage, but galaxy is a half step behind. Maybe they can do better with s22. It's not at all correct to say that it shits on them in this particular regard.