Patriot PXD 1TB M.2 PCIe Type-C External SSD Capsule Review
by Ganesh T S on September 29, 2020 8:00 AM EST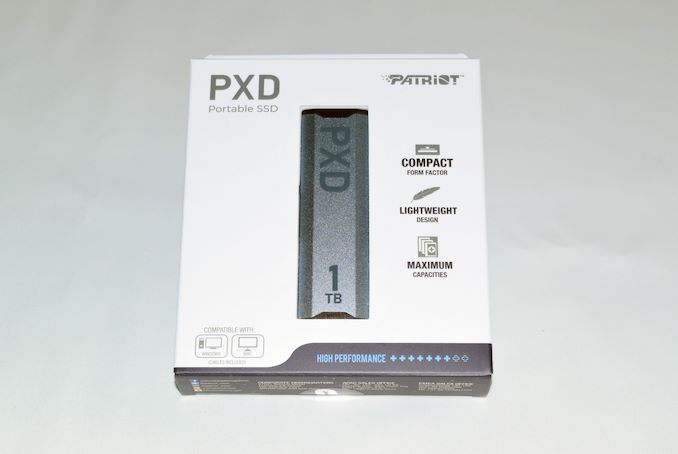
High-performance bus-powered direct-attached storage units have become very popular, thanks to the advent of high-speed interfaces and technologies such as USB 3.2 Gen 2, NVMe, and 3D NAND flash. Flash manufacturers such as Western Digital / SanDisk, Crucial (Micron), and Samsung produce and market external solid-state drives (SSDs) under their own brand. In addition, manufacturers such as Patriot Memory also buy flash in the open market and bring their own value additions to the external SSD market. Patriot Memory sent over a sample of the PXD external SSD launched in April 2020. This review takes a look at how the unit fares against other options available in this market segment.
Introduction
High-performance external storage devices use either Thunderbolt 3 or USB 3.2 Gen 2 for the host interface. Traditional SATA SSDs (saturating at 560 MBps) can hardly take full advantage of the bandwidth offered by USB 3.2 Gen 2. In the last 18 months or so, we have had a steady number of of NVMe drives behind a USB 3.2 Gen 2 (10Gbps) bridge entering the market.
Patriot Memory had a paper launch of the PXD external SSD back in April, and the units started hitting the market a couple of months after. The PXD has a gumstick form-factor, weighs 35g, and measures 31.5 mm x 103 mm x 9.8 mm. The aluminum body is sandwiched between two plastic tabs. It comes with a single Type-C port and two separate USB 3.2 Gen 2 cables - a Type-C to Type-C, and a Type-C to Type-A, each measuring 30cm.
In this review, we compare it against the following DAS units that we have reviewed before.
- Patriot PXD 1TB
- ADATA SE800 1TB
- Crucial Portable SSD X8 1TB
- HP P700 1TB
- Lexar SL100 Pro 1TB
- Samsung Portable SSD T7 Touch 1TB
- SanDisk Extreme Pro Portable SSD 1TB
A quick overview of the internal capabilities of the storage devices is given by CrystalDiskInfo.
| Drive Information |
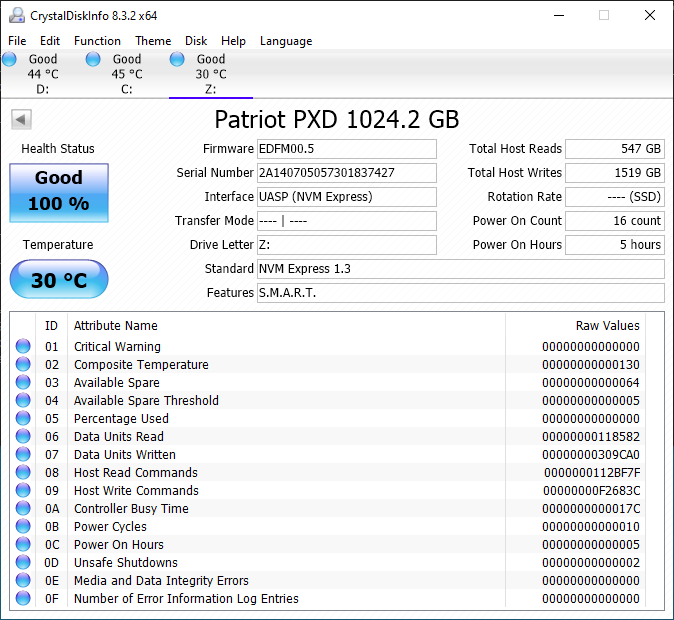 |
The firmware version points to the use of a SSD controller from Phison, which was confirmed in the teardown process. Similar to other external SSDs adopting this configuration (NVMe SSD behind a USB 3.2 Gen 2 bridge), the Patriot PXD also has no trouble with S.M.A.R.T pass-through and TRIM support (the latter of which is not reflected in the CrystalDiskInfo features entry).


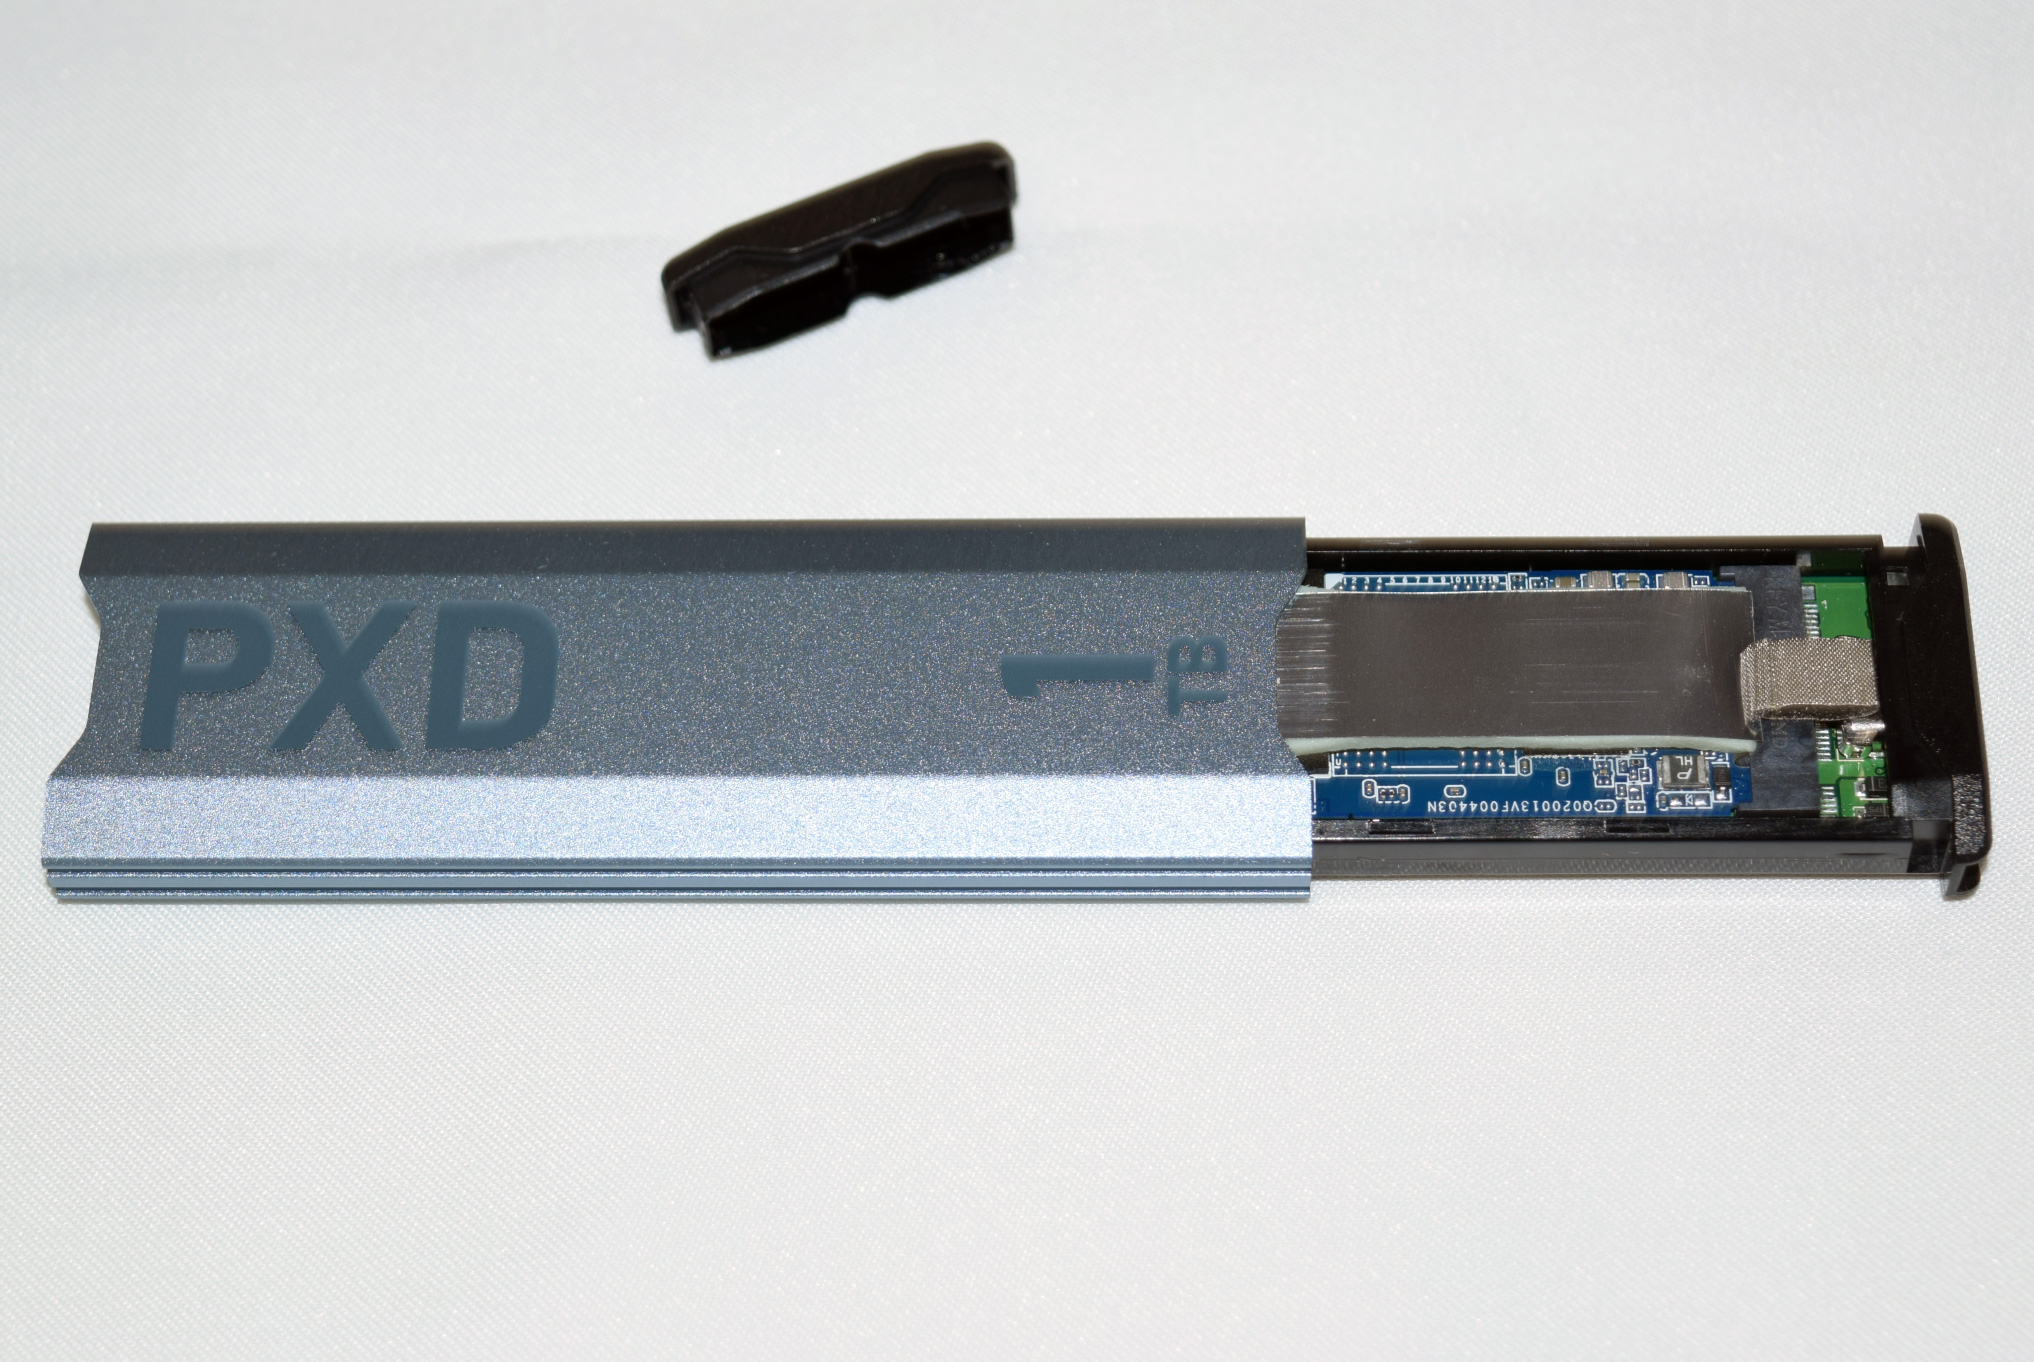
The gallery above presents some pictures of the internals. Patriot is no stranger to Phison-based external SSDs, having brought their Thunderbolt 3 reference design to market back in 2018. Our PXD review sample uses the US version of the Patriot P300 NVMe SSD behind a JMicron JMS583 bridge chip.
Testbed Setup and Testing Methodology
Evaluation of DAS units on Windows is done with a Hades Canyon NUC configured as outlined below. We use one of the rear USB Type-C ports enabled by the Alpine Ridge controller for both Thunderbolt 3 and USB devices.
| AnandTech DAS Testbed Configuration | |
| Motherboard | Intel NUC8i7HVB |
| CPU | Intel Core i7-8809G Kaby Lake, 4C/8T, 3.1GHz (up to 4.2GHz), 14nm+, 8MB L2 |
| Memory | Crucial Technology Ballistix DDR4-2400 SODIMM 2 x 16GB @ 16-16-16-39 |
| OS Drive | Intel Optane SSD 800p SSDPEK1W120GA (118 GB; M.2 Type 2280 PCIe 3.0 x2 NVMe; Optane) |
| SATA Devices | Intel SSD 545s SSDSCKKW512G8 (512 GB; M.2 Type 2280 SATA III; Intel 64L 3D TLC) |
| Chassis | Hades Canyon NUC |
| PSU | Lite-On 230W External Power Brick |
| OS | Windows 10 Enterprise x64 (v1909) |
| Thanks to Intel for the build components | |
Our evaluation methodology for direct-attached storage devices adopts a judicious mix of synthetic and real-world workloads. While most DAS units targeting a particular market segment advertise similar performance numbers and also meet them for common workloads, the real differentiation is brought out on the technical side by the performance consistency metric and the effectiveness of the thermal solution. Industrial design and value-added features may also be important for certain users. The remaining sections in this review tackle all of these aspects after analyzing the features of the drives in detail.
Device Features and Characteristics
Prior to looking at the usage characteristics of the Patriot PXD, it is helpful to compare its specifications against other similar SSDs.
| Direct-Attached Storage Characteristics | ||
| Aspect | ||
| Upstream Port | USB 3.2 Gen 2 Type-C | USB 3.2 Gen 2 Type-C |
| Bridge / Controller | JMicron JMS583 + Phison E13T | ASMedia ASM2362 + Innogrit IG5208 |
| Flash | Kioxia (Toshiba) BiCS 4 96L 3D TLC | Micron 64L 3D TLC |
| Power | Bus Powered | Bus Powered |
| Physical Dimensions | 31.5 mm x 103 mm x 9.8 mm | 72.7 mm x 44 mm x 12.2 mm |
| IP Rating | N/A | IP68 |
| Weight | 35 grams (without cable) | 40 grams (without cable) |
| Cable | 30 cm USB 3.2 Gen 2 Type-C to Type-A 30 cm USB 3.2 Gen 2 Type-C to Type-C |
20 cm USB 3.2 Gen 2 Type-C to Type-C 20 cm USB 3.2 Gen 2 Type-C to Type-A |
| S.M.A.R.T Passthrough | Yes | Yes |
| UASP Support | Yes | Yes |
| TRIM Passthrough | Yes | Yes |
The Patriot PXD is the lightest of all the SSDs, coming in at 35g. The unit is fairly compact, though it is not as small as the ADATA SE800. Similar to Samsung, Patriot also supplies two separate cables with the unit (while most other vendors supply an adapter for the Type-C to Type-A conversion). The cable length (30cm) is also the maximum length that we have seen so far in this space - allowing for the PXD to be used fairly easily even with Type-C ports in the rear panel of desktop systems.
Synthetic Benchmarks - ATTO and CrystalDiskMark
Patriot claims read and write speeds of up to 1000 MBps, and these are backed up by the ATTO benchmarks provided below. Unfortunately, these access traces are not very common in real-life scenarios.
| Drive Performance Benchmarks - ATTO |
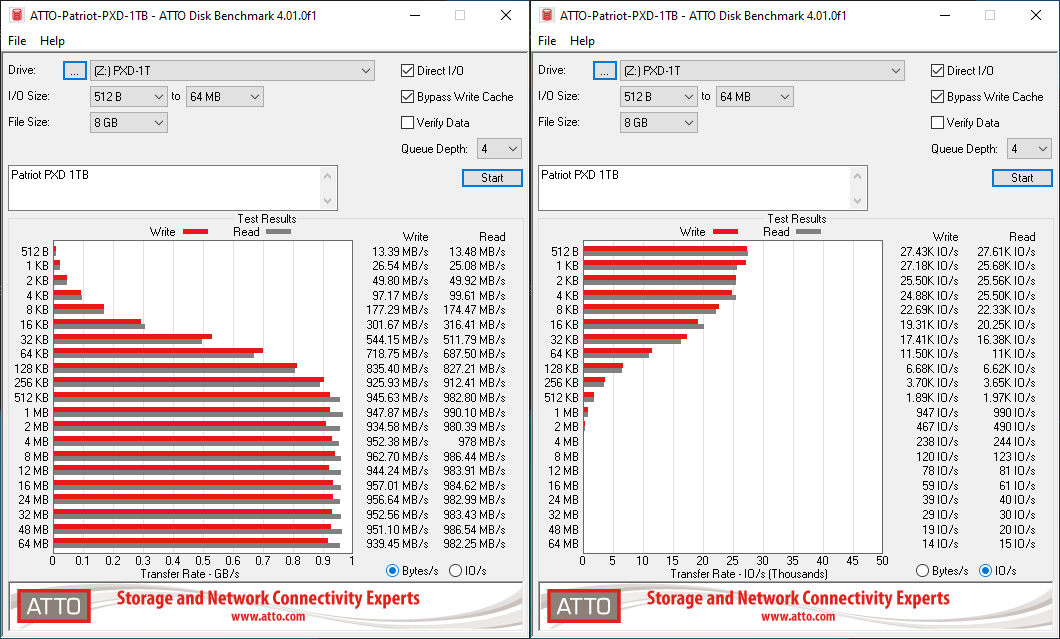 |
The ATTO benchmark reports maximum read and write speeds of around 986 MBps and 957 MBps respectively.
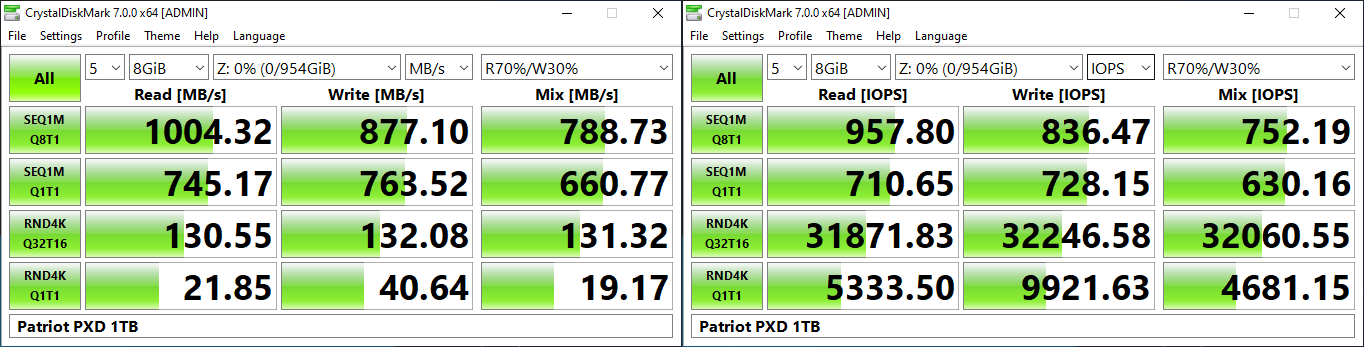
CrystalDiskMark, despite being a canned benchmark, provides a better estimate of the performance range with a selected set of numbers. As evident from the screenshot below, the performance can dip to as low as 22 MBps for 4K random reads.
| Drive Performance Benchmarks - CrystalDiskMark |
 |
AnandTech DAS Suite - Benchmarking for Performance Consistency
Our testing methodology for DAS units takes into consideration the usual use-case for such devices. The most common usage scenario is transfer of large amounts of photos and videos to and from the unit. Other usage scenarios include the use of the DAS as a download or install location for games and importing files directly off the DAS into a multimedia editing program such as Adobe Photoshop. Some users may even opt to boot an OS off an external storage device.
The AnandTech DAS Suite tackles the first use-case. The evaluation involves processing three different workloads:
- Photos: 15.6 GB collection of 4320 photos (RAW as well as JPEGs) in 61 sub-folders
- Videos: 16.1 GB collection of 244 videos (MP4 as well as MOVs) in 6 sub-folders
- BR: 10.7 GB Blu-ray folder structure of the IDT Benchmark Blu-ray
Each workload's data set is first placed in a 25GB RAM drive, and a robocopy command is issued to transfer it to the DAS under test (formatted in NTFS). Upon completion of the transfer (write test), the contents from the DAS are read back into the RAM drive (read test). This process is repeated three times for each workload. Read and write speeds, as well as the time taken to complete each pass are recorded. Bandwidth for each data set is computed as the average of all three passes.
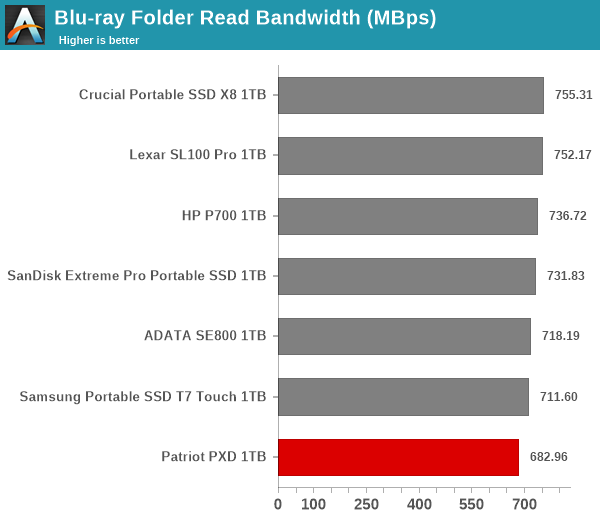
The Patriot PXD makes it marks in the lower half of the comparison charts consistently across all benchmarks. That said, it can be seen that there is no significant gulf in the numbers between the different units. For all practical purposes, the casual user will notice no difference between them in the course of normal usage. However, power users may want to dig deeper to understand the limits of each device. To address this concern, we also instrumented our evaluation scheme for determining performance consistency.
Performance Consistency
Aspects influencing the performance consistency include SLC caching and thermal throttling / firmware caps on access rates to avoid overheating. This is important for power users, as the last thing that they want to see when copying over 100s of GB of data is the transfer rate going down to USB 2.0 speeds.
In addition to tracking the instantaneous read and write speeds of the DAS when processing the AnandTech DAS Suite, the temperature of the drive was also recorded at the beginning and end of the processing. In earlier reviews, we used to track the temperature all through. However, we have observed that SMART read-outs for the temperature in NVMe SSDs using USB 3.2 Gen 2 bridge chips end up negatively affecting the actual transfer rates. To avoid this problem, we have restricted ourselves to recording the temperature at either end of the actual workloads set. The graphs below present the recorded data.
| Performance Consistency and Thermal Characteristics |
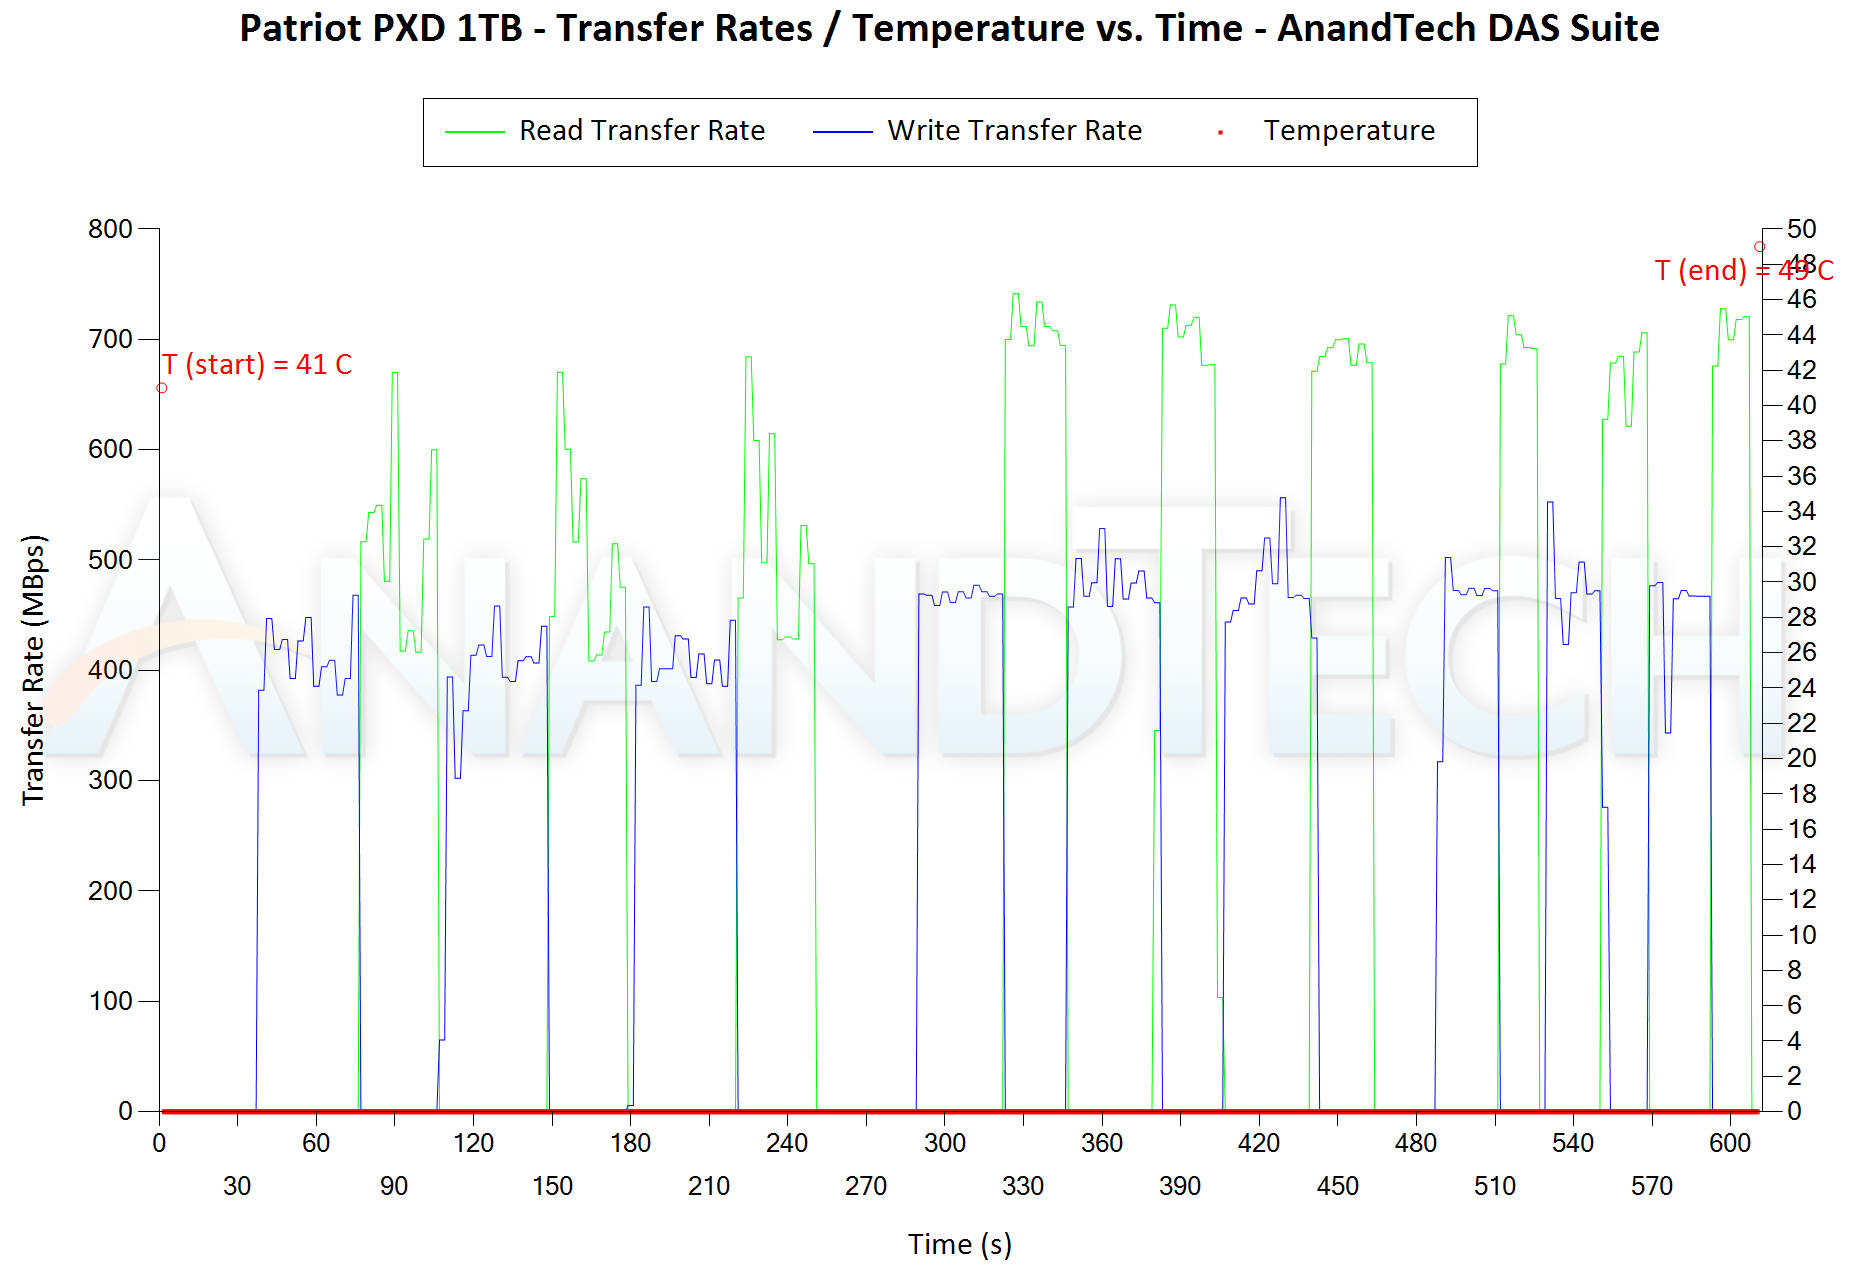 |
The first three sets of writes and reads correspond to the photos suite. A small gap (for the transfer of the video suite from the internal SSD to the RAM drive) is followed by three sets for the video suite. Another small RAM-drive transfer gap is followed by three sets for the Blu-ray folder. An important point to note here is that each of the first three blue and green areas correspond to 15.6 GB of writes and reads respectively. The temperature of the SSD at the end of the process was less than 50C, pointing to a well-designed thermal solution that prevents the drive from getting throttle under heavy realistic traffic.
PCMark 10 Storage Bench - Real-World Access Traces
There are a number of storage benchmarks that can subject a device to artificial access traces by varying the mix of reads and writes, the access block sizes, and the queue depth / number of outstanding data requests. We saw results from two popular ones - ATTO, and CrystalDiskMark - in a previous section. More serious benchmarks, however, actually replicate access traces from real-world workloads to determine the suitability of a particular device for a particular workload. Real-world access traces may be used for simulating the behavior of computing activities that are limited by storage performance. Examples include booting an operating system or loading a particular game from the disk.
PCMark 10's storage bench (introduced in v2.1.2153) includes four storage benchmarks that use relevant real-world traces from popular applications and common tasks to fully test the performance of the latest modern drives:
- The Full System Drive Benchmark uses a wide-ranging set of real-world traces from popular applications and common tasks to fully test the performance of the fastest modern drives. It involves a total of 204 GB of write traffic.
- The Quick System Drive Benchmark is a shorter test with a smaller set of less demanding real-world traces. It subjects the device to 23 GB of writes.
- The Data Drive Benchmark is designed to test drives that are used for storing files rather than applications. These typically include NAS drives, USB sticks, memory cards, and other external storage devices. The device is subjected to 15 GB of writes.
- The Drive Performance Consistency Test is a long-running and extremely demanding test with a heavy, continuous load for expert users. In-depth reporting shows how the performance of the drive varies under different conditions. This writes more than 23 TB of data to the drive.
Despite the data drive benchmark appearing most suitable for testing direct-attached storage, we opted to run the full system drive benchmark as part of our evaluation flow. Many of us use portable flash drives as boot drives and storage for Steam games. These types of use-cases are addressed only in the full system drive benchmark.
The Full System Drive Benchmark comprises of 23 different traces. For the purpose of presenting results, we classify them under five different categories:
- Boot: Replay of storage access trace recorded while booting Windows 10
- Creative: Replay of storage access traces recorded during the start up and usage of Adobe applications such as Acrobat, After Effects, Illustrator, Premiere Pro, Lightroom, and Photoshop.
- Office: Replay of storage access traces recorded during the usage of Microsoft Office applications such as Excel and Powerpoint.
- Gaming: Replay of storage access traces recorded during the start up of games such as Battlefield V, Call of Duty Black Ops 4, and Overwatch.
- File Transfers: Replay of storage access traces (Write-Only, Read-Write, and Read-Only) recorded during the transfer of data such as ISOs and photographs.
PCMark 10 also generates an overall score, bandwidth, and average latency number for quick comparison of different drives. The sub-sections below reference the access traces specified in the PCMark 10 Technical Guide.
Booting Windows 10
The read-write bandwidth recorded for each drive in the boo access trace is presented below.
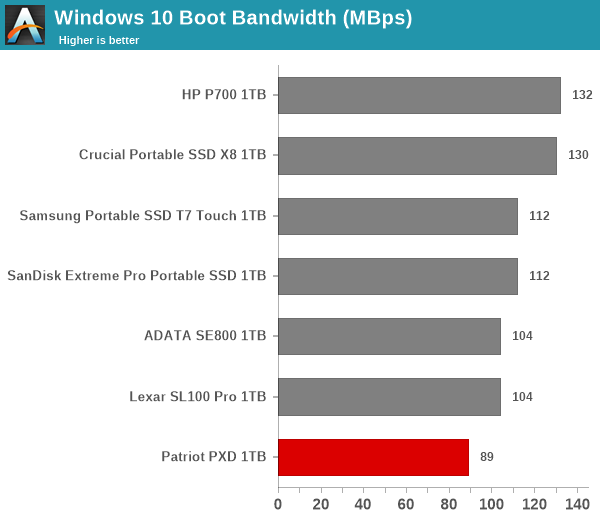
The Patriot PXD is significantly worse off than the read-optimized SSDs like the Crucial X8 and all-round optimized ones like the HP P700. In fact, it is the only USB 3.1 Gen 2 NVMe SSD with a sub-100 MBps bandwidth number in the boot workload.
Creative Workloads
The read-write bandwidth recorded for each drive in the sacr, saft, sill, spre, slig, sps, aft, exc, ill, ind, psh, and psl access traces are presented below.
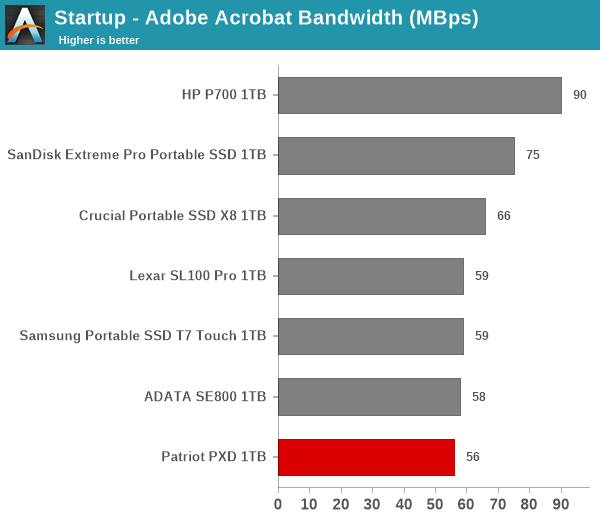
The Patriot PXD comes in the bottom half of the table for almost all creative workloads.
Office Workloads
The read-write bandwidth recorded for each drive in the exc and pow access traces are presented below.
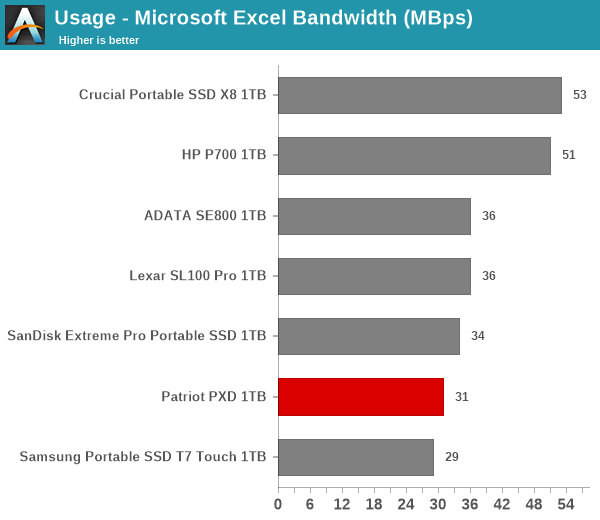
The behavior repeats in the office workload, though, to Patriot's credit, the numbers are bunched much closer in the middle of the pack.
Gaming Workloads
The read-write bandwidth recorded for each drive in the bf, cod, and ow access traces are presented below.
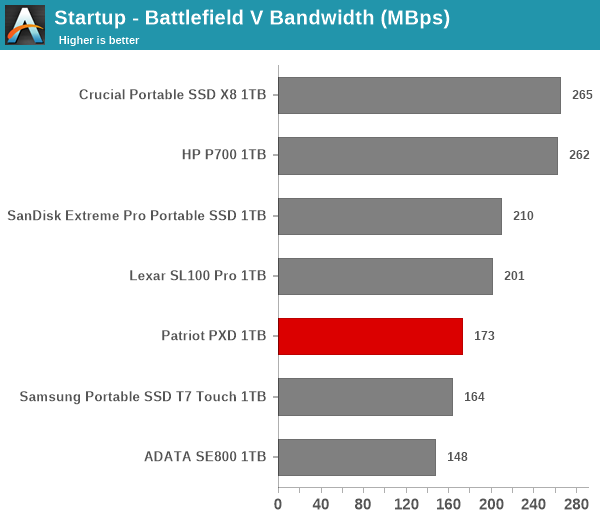
Patriot also markets the PXD for usage with game consoles. In the gaming workloads, the unit acquits itself better with a middle-of-the-pack performance.
Files Transfer Workloads
The read-write bandwidth recorded for each drive in the cp1, cp2, cp3, cps1, cps2, and cps3 access traces are presented below.
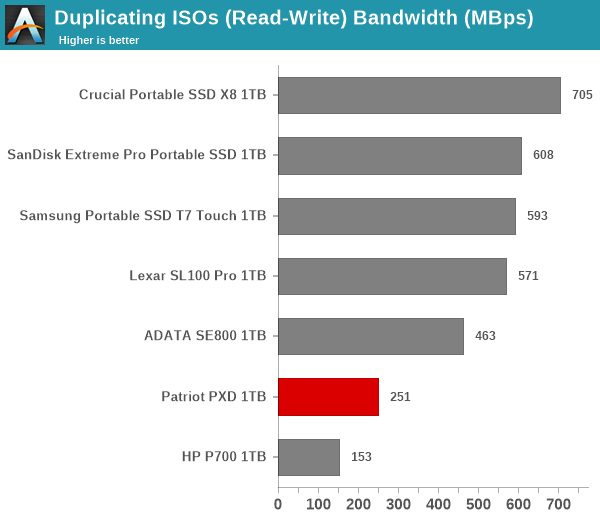
The PXD suffers badly with mixed workloads as well as write-only ones where heavy file transfers that quickly fill up the SLC cache cause precipitious drops in the bandwidth numbers.
Overall Scores
PCMark 10 reports an overall score based on the observed bandwidth and access times for the full workload set. The score, bandwidth, and average access latency for each of the drives are presented below.
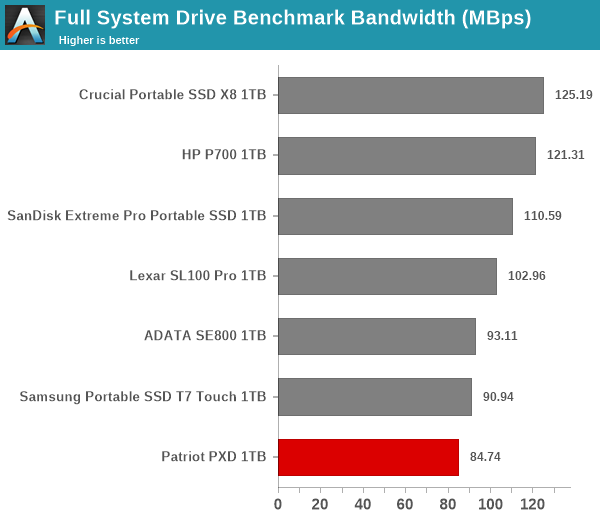
Overall, the Patriot PXD doesn't fare well with the PCMark 10 storage bench, coming in at the bottom of the table.
Miscellaneous Aspects and Concluding Remarks
The performance of the drives in various real-world access traces as well as synthetic workloads was brought out in the preceding sections. We also looked at the performance consistency for these cases. Power users may also be interested in performance consistency under worst-case conditions, as well as drive power consumption. The latter is also important when used with battery powered devices such as notebooks and smartphones. Pricing is also an important aspect. We analyze each of these in detail below.
Worst-Case Performance Consistency
Flash-based storage devices tend to slow down in unpredictable ways when subject to a large number of small-sized random writes. Many benchmarks use that scheme to pre-condition devices prior to the actual testing in order to get a worst-case representative number. Fortunately, such workloads are uncommon for direct-attached storage devices, where workloads are largely sequential in nature. Use of SLC caching as well as firmware caps to prevent overheating may cause drop in write speeds when a flash-based DAS device is subject to sustained sequential writes.
Our Sequential Writes Performance Consistency Test configures the device as a raw physical disk (after deleting configured volumes). A fio workload is set up to write sequential data to the raw drive with a block size of 128K and iodepth of 32 to cover 90% of the drive capacity. The internal temperature is recorded at either end of the workload, while the instantaneous write data rate and cumulative total write data amount are recorded at 1-second intervals.
| Sequential Write to 90% of Disk Capacity - Performance Consistency |
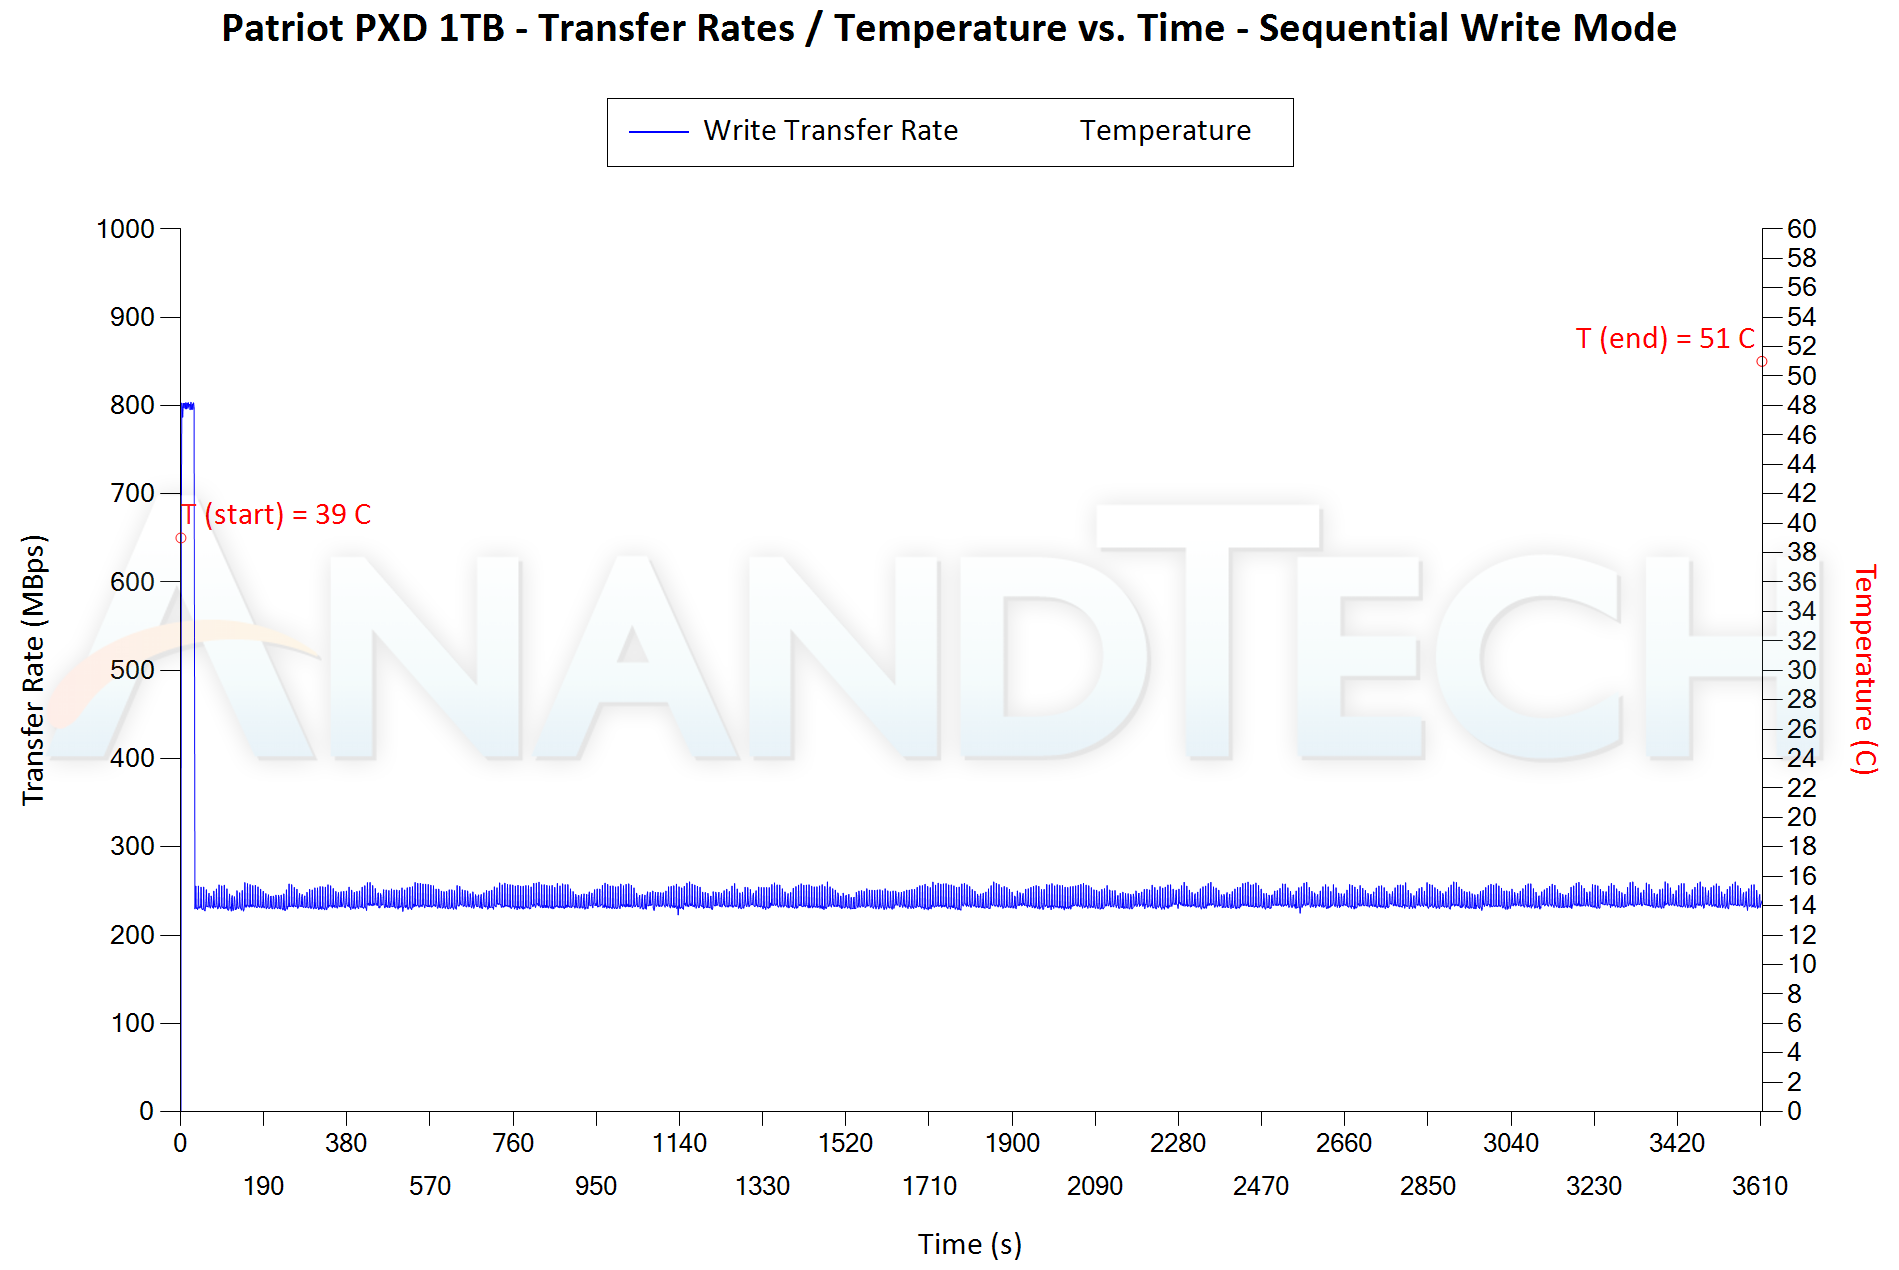 |
The Patriot PXD 1TB drive starts off at around 800 MBps and sustains it for around 24GB of continuous writes before showing a steep drop to 250 MBps. Fortunately, it exhibits consistency at that mark, and doesn't suffer any additional problems for the rest of the filling process. The internal temperature also looks good, with just a 12C delta, and a final value of 51C.
Power Consumption
Bus-powered devices can configure themselves to operate within the power delivery constraints of the host port. While Thunderbolt 3 ports are guaranteed to supply up to 15W for client devices, USB 2.0 ports are guaranteed to deliver only 4.5W (900mA @ 5V). In this context, it is interesting to have a fine-grained look at the power consumption profile of the various drives. Using the Plugable USBC-TKEY, the bus power consumption of the drives was tracked while processing the CrystalDiskMark workloads (separated by 30s intervals). The graphs below plot the instantaneous bus power consumption against time, while singling out the maximum and minimum power consumption numbers.
| Drive Power Consumption - CrystalDiskMark Workloads |
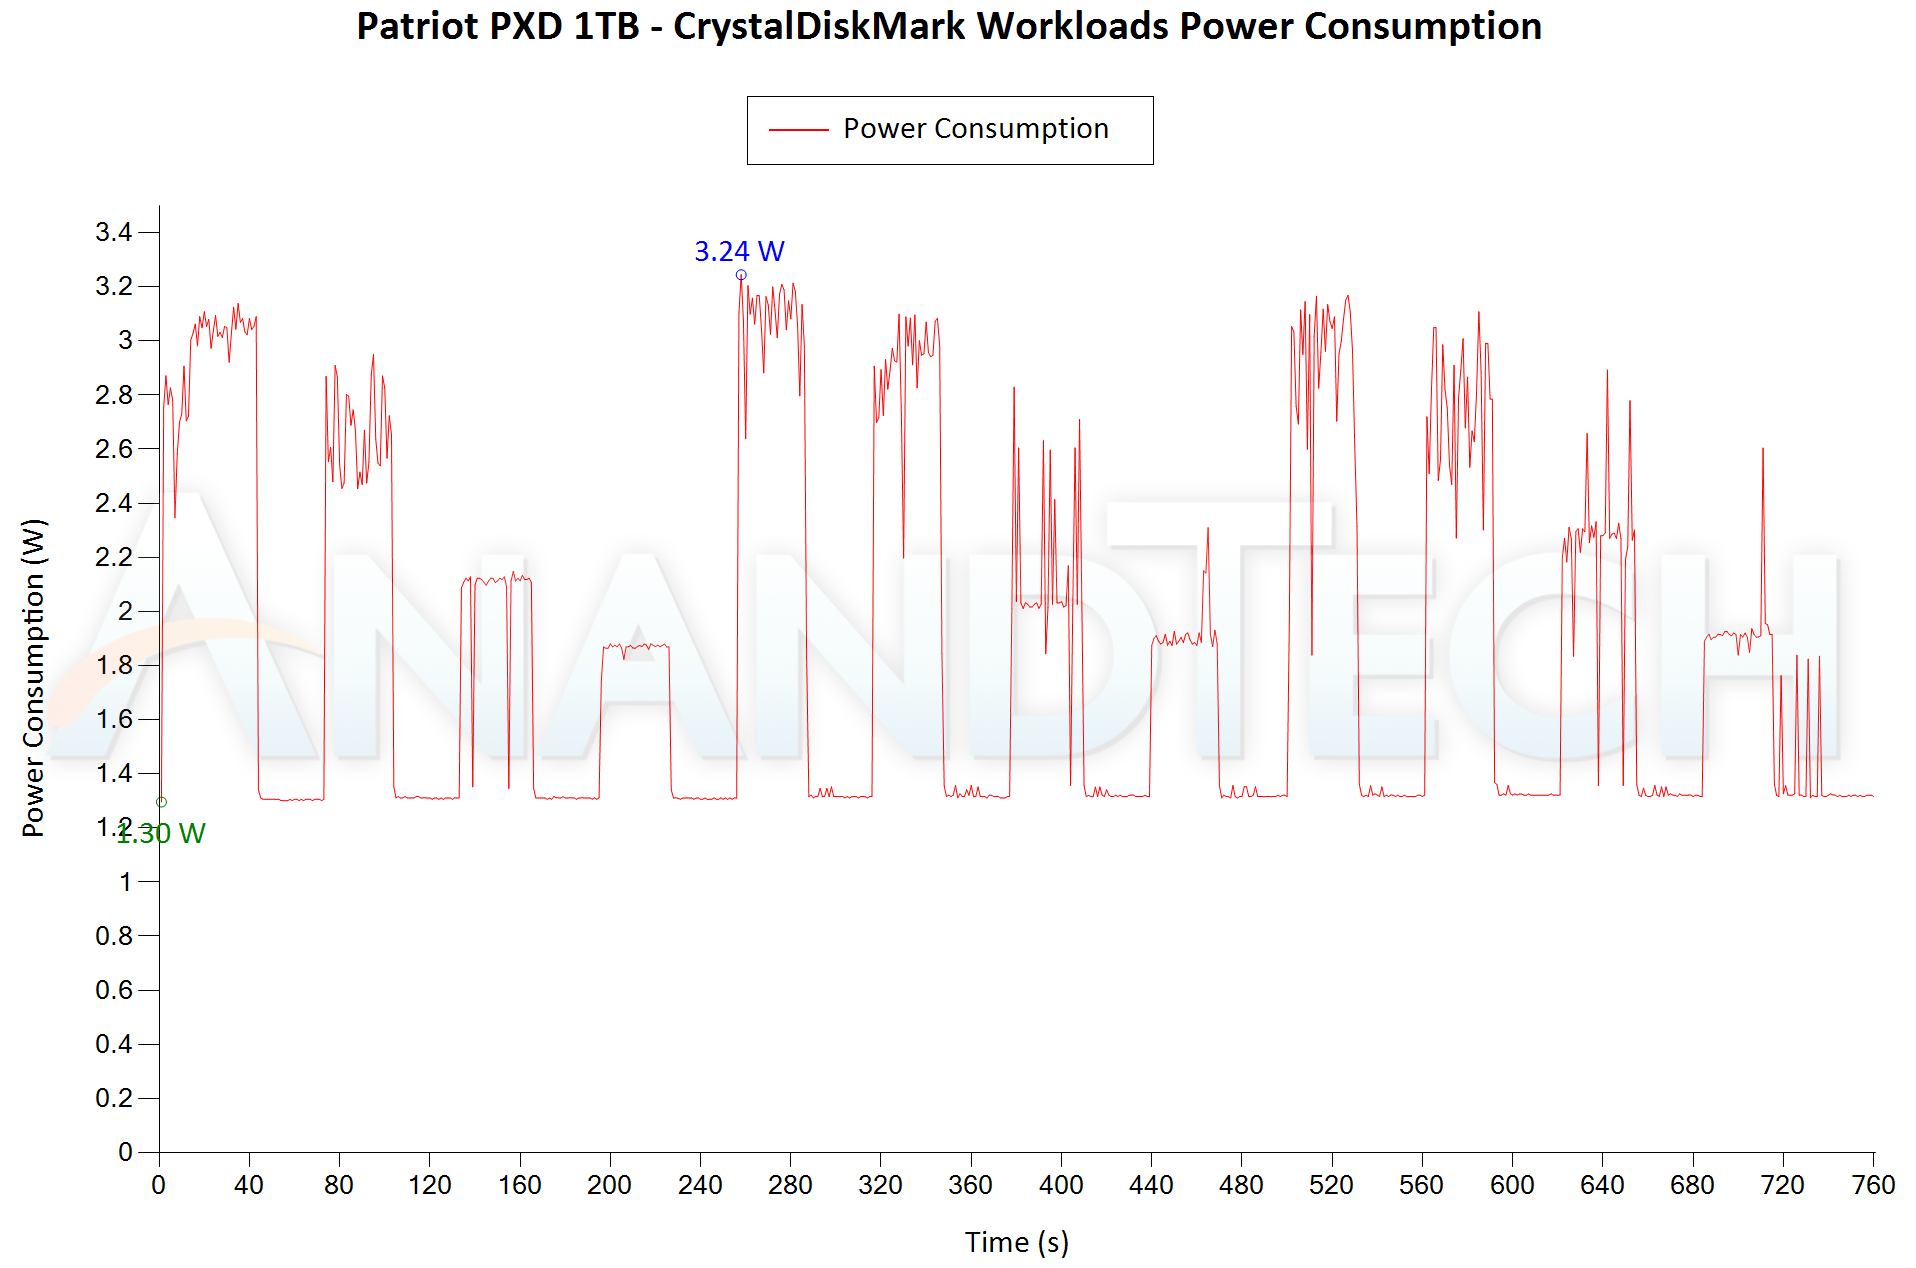 |
The 1.3W idle power consumption augurs well for the usage of the drive with battery-powered devices like notebooks and tablets. The peak consumption is also 3.24W, which is well below the 4.5W guaranteed by almost all USB 2.0 ports.
Pricing
The price of flash-based storage devices tend to fluctuate quite a bit over time. However, the relative difference between different models usually doesn't change. The table below summarizes the product links and pricing for the various units discussed in the review.
| External Flash Storage Devices - Pricing | ||||
| Product | Model Number | Capacity (GB) | Street Price (USD) | Price per GB (USD/GB) |
| ADATA SE800 1TB | ASE800-1TU32G2-CBK | 1000 | $130 | 0.13 |
| Crucial Portable SSD X8 1TB | CT1000X8SSD9 | 1000 | $150 | 0.15 |
| Patriot PXD 1TB | PXD1TBPEC | 1000 | $170 | 0.17 |
| HP P700 1TB | 5MS30AA#ABC | 1000 | $175 | 0.175 |
| Lexar SL100 Pro 1TB | LSL100P-1TBRBNA | 1000 | $190 | 0.19 |
| Samsung Portable SSD T7 Touch 1TB | MU-PC1T0S/WW | 1000 | $190 | 0.19 |
| SanDisk Extreme Pro Portable SSD 1TB | SDSSDE80-1T00-A25 | 1000 | $190 | 0.19 |
At 17c/GB, the Patriot PXD is not the cheapest external SSD in the market. Similar to its performance profile, its pricing also lands it in the lower half of the cost table. But, this is to the advantage of the consumers.
Final Words
After careful analysis of various aspects (including benchmark numbers, temperatures, power consumption, and pricing), it is clear that the Patriot PXD is not the drive to get if raw performance numbers are the only metric. What the drive lacks in performance is more than made up for by its pleasing industrial design, compact footprint, and excellent thermal solution.
Patriot PXD External SSD - Lightweight, but Effective Thermal Solution
In short, if one looks past the comparative performance numbers, the external drive should satisfy the requirements of casual users.


4 Comments
View All Comments
ballsystemlord - Tuesday, September 29, 2020 - link
For a drive priced in the middle, it certainly performs poorly.James5mith - Tuesday, September 29, 2020 - link
How expensive were Alpine ridge/Titan Ridge that nobody ever made a hybrid external enclosure/SSD solution using them?I mean, a single enclosure or SSD that can do both TB3 and USB3 seemed like a no-brainer to me.
ganeshts - Tuesday, September 29, 2020 - link
It is there in the market if you know where to look :) I have one on the way for review.jackabramsX - Monday, November 2, 2020 - link
Plenty of decent pot filler faucets are floating around the market. However, not all pot fillers are made equal. Some will break after a year, or they will start forming leaks. Our list has condensed the pot fillers down to the absolute best ones on the market.https://greatlivings.com/best-wall-oven-reviews/