Google's Tensor inside of Pixel 6, Pixel 6 Pro: A Look into Performance & Efficiency
by Andrei Frumusanu on November 2, 2021 8:00 AM EST- Posted in
- Mobile
- Smartphones
- SoCs
- Pixel 6
- Pixel 6 Pro
- Google Tensor
CPU Performance & Power
On the CPU side of things, the Tensor SoC, as we discussed, does have some larger configuration differences to what we’ve seen on the Exynos 2100, and is actually more similar to the Snapdragon 888 in that regard, at least from the view of a single Cortex-X1 cores. Having double the L2 cache, however being clocked 3.7%, or 110MHz lower, the Tensor and the Exynos should perform somewhat similarly, but dependent on the workload. The Snapdragon 888 showcases much better memory latency, so let’s also see if that actually plays out as such in the workloads.

In the individual subtests in the SPEC suite, the Tensor fares well and at first glance isn’t all too different from the other two competitor SoCs, albeit there are changes, and there are some oddities in the performance metrics.
Pure memory latency workloads as expected seem to be a weakness of the chip (within what one call weakness given the small differences between the different chips). 505.mcf_r falls behind the Exynos 2100 by a small amount, the doubled L2 cache should have made more of a difference here in my expectations, also 502.gcc_r should have seen larger benefits but they fail to materialise. 519.lbm_r is bandwidth hungry and here it seems the chip does have a slight advantage, but power is still extremely high and pretty much in line with the Exynos 2100, quite higher than the Snapdragon 888.
531.deepsjeng is extremely low – I’ve seen this behaviour in another SoC, the Dimensity 1200 inside the Xiaomi 11T, and this was due to the memory controllers and DRAM running slower than intended. I think we’re seeing the same characteristic here with the Tensor as its way of controlling the memory controller frequency via CPU memory stall counters doesn’t seem to be working well in this workload. 557.xz_r is also below expectations, being 18% slower than the Snapdragon 888, and ending up using also more energy than both Exynos and Snapdragon. I remember ex-Arm’s Mike Filippo once saying that every single clock cycle the core is wasting on waiting on memory has bad effects on performance and efficiency and it seems that’s what’s happening here with the Tensor and the way it controls memory.
In more execution bound workloads, in the int suite the Tensor does well in 525.x264 which I think is due to the larger L2. On the FP suite, we’re seeing some weird results, especially on the power side. 511.povray appears to be using a non-significant amount lesser power than the Exynos 2100 even though performance is identical. 538.imagick also shows much less power usage on the part of the Tensor, at similar performance. Povray might benefit from the larger L2 and lower operating frequency (less voltage, more efficiency), but I can’t really explain the imagick result – in general the Tensor SoC uses quite less power in all the FP workloads compared to the Exynos, while this difference isn’t as great in the INT workloads. Possibly the X1 cores have some better physical implementation on the Tensor chip which reduces the FP power.

In the aggregate scores, the Tensor / GS101 lands slightly worse in performance than the Exynos 2100, and lags behind the Snapdragon 888 by a more notable 12.2% margin, all whilst consuming 13.8% more energy due to completing the task slower. The performance deficit against the Snapdragon should really only be 1.4% - or a 40MHz difference, so I’m attributing the loss here just to the way Google runs their memory, or maybe also to possible real latency disadvantages of the SoC fabric. In SPECfp, which is more memory bandwidth sensitive (at least in the full suite, less so in our C/C++ subset), the Tensor SoC roughly matches the Snapdragon and Exynos in performance, while power and efficiency is closer to the Snapdragon, using 11.5% less power than the Exynos, and thus being more efficient here.
One issue that I encountered with the Tensor, that marks it being extremely similar in behaviour to the Exynos 2100, is throttling on the X1 cores. Notably, the Exynos chip had issues running its cores at their peak freq in active cooling under room temperature (~23°C) – the Snapdragon 888 had no such issues. I’m seeing similar behaviour on the Google Tensor’s X1 cores, albeit not as severe. The phone notably required sub-ambient cooling (I tested at 11°C) to get sustained peak frequencies, scoring 5-9% better, particularly on the FP subtests.
I’m skipping over the detailed A76 and A55 subscores of the Tensor as it’s not that interesting, however the aggregate scores are something we must discuss. As alluded to in the introduction, Google’s choice of using an A76 in the chip seemed extremely hard to justify, and the practical results we’re seeing the testing pretty much confirm our bad expectations of this CPU. The Tensor is running the A76 at 2.25GHz. The most similar data-point in the chart is the 2.5GHz A76 cores of the Exynos 990 – we have to remember this was an 7LPP SoC while the Tensor is a 5LPE design like the Eynos 2100 and Snapdraogn 888.
The Tensor’s A76 ends up more efficient than the Exynos 990’s – would would hope this to be the case, however when looking at the Snapdragon 888’s A78 cores which perform a whopping 46% better while using less energy to do so, it makes the Tensor’s A76 mid-cores look extremely bad. The IPC difference between the two chips is indeed around 34%, which is in line with the microarchitectural gap between the A76 and A78. The Tensor’s cores use a little bit less absolute power, but if this was Google top priority, they could have simply clocked a hypothetical A78 lower as well, and still ended up with a more performant and more efficient CPU setup. All in all, we didn’t understand why Google chose A76’s, as all the results end up expectedly bad, with the only explanation simply being that maybe Google just didn’t have a choice here, and just took whatever Samsung could implement.
On the side of the Cortex-A55 cores, things also aren’t looking fantastic for the Tensor SoC. The cores do end up performing the equally clocked A55’s of the Snapdragon 888 by 11% - maybe due to the faster L3 access, or access to the chip’s SLC, however efficiency here just isn’t good, as it uses almost double the power, and is more characteristic of the higher power levels of the Exynos chips’ A55 cores. It’s here where I come back to say that what makes a SoC from one vendor different to the SoC from another is the very foundations and fabric design - for the low-power A55 cores of the Tensor, the architecture of the SoC encounters the same issues of being overshadowed in system power, same as we see on Exynos chips, ending up in power efficiency that’s actually quite worse than the same chips own A76 cores, and much worse than the Snapdragon 888. MediaTek’s Dimensity 1200 even goes further in operating their chip in seemingly the most efficient way for their A55 cores, not to mention Apple’s SoCs.
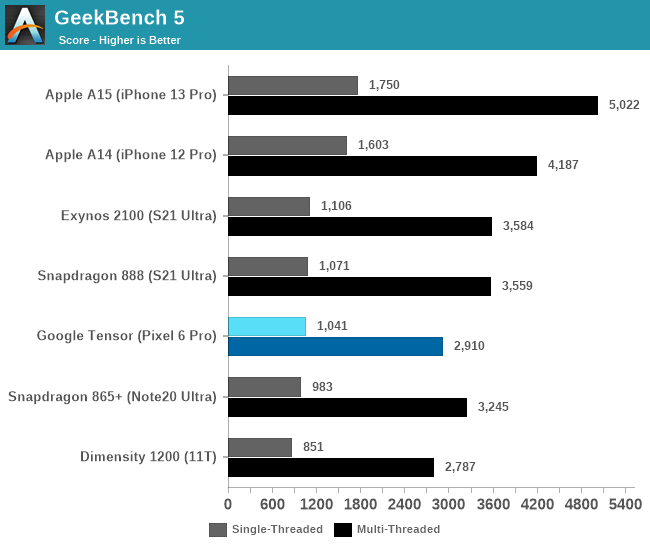
While we don’t run multi-threaded SPEC on phones, we can revert back to GeekBench 5 which serves the purpose very well.
Although the Google Tensor has double as many X1 cores as the other Android SoCs, the fact that the Cortex-A76 cores underperform by such a larger degree the middle cores of the competition, means that the total sum of MT performance of the chip is lesser than that of the competition.
Overall, the Google Tensor’s CPU setup, performance, and efficiency is a mixed bag. The two X1 cores of the chip end up slightly slower than the competition, and efficiency is most of the time in line with the Exynos 2100’s X1 cores – sometimes keeping up with the Snapdragon 888 in some workloads. The Cortex-A76 middle cores of the chip in my view make no sense, as their performance and energy efficiency just aren’t up to date with 2021 designs. Finally, the A55 behavioural characteristic showcases that this chip is very much related to Samsung’s Exynos SoCs, falling behind in efficiency compared to how Qualcomm or MediaTek are able to operate their SoCs.


108 Comments
View All Comments
jaju123 - Tuesday, November 2, 2021 - link
Thanks Andrei, using the P6 Pro right now and it is remarkably smooth in terms of general UI regardless of the benchmark scores etc., in comparison to other phones. I suspect the scheduling and UI rendering side of things are contributing here. Very much looking forward to the camera review!jiffylube1024 - Wednesday, November 3, 2021 - link
Same experience here on a P6 regular.I went from an S20 (regular) to the P6 pro. Wife has the S21 regular.
My experience so far:
UI is insanely fast and smooth on the P6. Everything is buttery smooth, no lag ever. It's a joy to use. The S20 is a very fast phone, but it did have the very occasional hiccup when switching between many different apps. So far, this hasn't happened on the Pixel 6 at all.
The S20 had nicer hardware overall, and the hand size was perfect. S20 screen gets a bit brighter, was a tiny bit sharper, and auto-adjust brightness was basically perfect on the S20, it's a little bit imperfect on the P6 (occasionally goes up or down in low light for no reason).
All in all, I'm very happy with the Pixel 6. If the Pixel 7 comes in a 6"-6.2" version next year, I may have to switch again, though!
Kangal - Wednesday, November 3, 2021 - link
That's because it is running a mostly Stock OS. Google severely limits background tasks when in use, and prioritises touch input... as opposed to say Samsung, which starts off slower and raises frequency in steps, whilst continuing background tasks. This slows the experience, but can boost efficiency, depending on the user.Now, the Cortex-A76 is actually not bad. It's a great chip, as it's quiet fast while being efficient. It requires less area and density compared to the A77 and A78. So Google didn't make a mistake here. By going for the A76, they were able to upgrade to have two Cortex-X1 cores. It is a design choice. Another design choice could be 3x X1 and 5x A55, cutting out the Middle-cores for a more simpler design. Or you could potentially have 4x A78 and 4x A55, and have the A78 cores clock higher, for better sustained performance than X1. These are all different design choices, one can be better than another, but it depends on the circumstances.
Kangal - Wednesday, November 3, 2021 - link
I just want to add my viewpoint on the performance and efficiency of this chipset/phone.AI/ML/NPU/TPU Benchmark: GeekBench ML 0.5
This looks like the most accurate representation. The iPhone 13 has an impressive AI performance because their SDK is better fleshed out, their software is coded more natively, and the SoC has pretty impressive specs Cache, CPU, GPU to help with such tasks. The GS101 wins in the Android ecosystem by a wide margin, followed by QSD 888, MediaTek Dimensity, then lastly Exynos. We can see the proper AI chart here: https://images.anandtech.com/graphs/graph17032/126...
GPU Benchmark: GFxBench Aztec Ruins High (Sustained)
This looks like the most accurate representation. Again Apple flexes its lead with its optimised software and cutting-edge hardware. Larger phones with better cooling manage to score higher, and giving preference to Qualcomm's mature drivers, followed by Huawei's node advantage, then the mediocre attempts by Exynos which is tied for the last spot with the GS101. We can see the proper GPU chart here: https://images.anandtech.com/graphs/graph17032/101...
CPU Multithread Benchmark: GeekBench 5 (crude Single/Multithread)
In the multi-thread test, it shows how sacrificing the middle cores has affected the total score, where it helps to boost the performance of the first 1-2 threads. So at least that design choice is captured. We can see the proper Multithread CPU chart here: https://images.anandtech.com/graphs/graph16983/116...
CPU Single-core Benchmark: SPEC 2017 (fp scores)
The SPEC test is more nuanced. We've established that Anandtech has made huge blunders here. Instead of reporting the Power Draw (watts) of the chipset, they instead try to calculate Energy Consumed (joules) by estimating it crudely. It is for that reason, we get some very inconsistent and wrong data. Such as Apple's Efficiency cores using less power than a Cortex-A53, yet producing scores in line with the Cortex-A78.
So instead, we will focus on the fp-scores instead of the int-scores, since this actually scales better from chipset to chipset. And we will focus on the Power Draw figures, to get the proper data. In particular, the tests of 526, 544, and 511 are quite revealing. We can see the proper CPU chart here:
https://images.anandtech.com/doci/16983/SPECfp-pow...
As a summary of the raw data, here:
Chipset-CoreType: Performance Value / Watts Recorded = Efficiency Score
Apple A14-E: 2.54 / 0.42 = 6.05
Apple A15-E: 3.03 / 0.52 = 5.83
Dim 1200-A55: 0.71 / 0.22 = 3.23
QSD 888-A55: 0.85 / 0.30 = 2.83
Exy 990-A55: 0.84 / 0.50 = 1.68 (? too low! Watts probably not recorded correctly)
Exy 2100-A55: 0.94 / 0.57 = 1.65 (? too low! Watts probably not recorded correctly)
GS 101-A55: 0.88 / 0.59 = 1.49 (? too low! Watts probably not recorded correctly)
Apple A15-P: 10.15 / 4.77 = 2.13
QSD 870-A77: 5.76 / 2.77 = 2.08
Apple A14-P: 8.95 / 4.72 = 1.90
QSD 888-X1: 6.28 / 3.48 = 1.80
GS 101-X1: 6.17 / 3.51 = 1.76
Dim 1200-A78: 4.71 / 2.94 = 1.60
Exy 2100-X1: 6.23 / 3.97 = 1.57
Exy 990-M5: 4.87 / 3.92 = 1.24
Andrei Frumusanu - Thursday, November 4, 2021 - link
> We've established that Anandtech has made huge blunders here. Instead of reporting the Power Draw (watts) of the chipset, they instead try to calculate Energy Consumed (joules) by estimating it crudely.I have no idea what you're referring to. The power draw is reported right there, and the energy isn't estimated, it's measured precisely. The A55 data is correct.
Perf/W is directly inversely relative to energy consumption if you would actually plot your data.
Kangal - Saturday, November 6, 2021 - link
The Specific Power Draw makes sense in the context of these comparisons. For the longest time in this industry, they've always talked about Performance per Watt. No-one, not even Intel (and they've been know to be quite shady) uses Performance per Joules.The total energy consumed in Joules is simply irrational. One can then make a flawed comparison of how much processing could be made through the consumption of a cupcake if you read it's nutritional content. Not only that, if you actually look at the data you guys submitted, it has a lot more variance with Joules, whilst Watts shows a lot more consistent results. Your energy consumed is an estimate, not what is specifically used by the cores when running.
For instance, when using Joules, it makes Apple's Efficiency cores seem to use slightly less power than a Cortex-A55, whilst performing benchmarks slightly faster than a Cortex-A76. If that is true, then no Android phones would be sold above $500 as everyone would simply buy iPhones. It's like comparing a 2011 processor (48nm Dual Cortex-A9) to a 2015 processor (16nm Octa Cortex-A53), so it's not only using less power, but delivering more than x4 times the performance. Ludicrous. You just cannot magically wave away discrepancies that big (x7.43). On the other hand, if you plot it using Watts, you get a deeper picture. Apple's Efficiency cores use about double the energy as a Cortex-A55 but in turn they deliver four times the performance, so the net difference is a much more palatable x2.14 leap in efficiency (at least in max performance comparison). And I'm comparing the latest Apple (A15) to Android (QSD 888) cores.
If the A55 data is as accurate as you say, why do you have discrepancies there as well?
For example, QSD 888 versus Google Silicon-101... they're both using off-the-shelf Cortex-A55. Yet, the Qualcomm's chipset is apparently drawing only 0.30 Watts, compared to 0.59 Watts... which is about x2 less. And both perform fairly close scores at 0.85 versus 0.88, making their total efficiency difference of x1.90 (2.83 vs 1.49) puzzling. So something is a miss. Going off the Joules Estimates doesn't fix the issue either, as you still have an unaccounted x1.83 difference in efficiency still.
With all your resources, you guys never got curious about such discrepancies?
(sorry for being a little obtuse)
dotjaz - Sunday, November 7, 2021 - link
You are obviously uneducated, and don't know what "off-the-shelf" means in any chips. Physical implementation varies a lot even on the same process with the same IP. Either you or Cadence are lying. I'd rather believe a reputable company with decades of experience.https://www.anandtech.com/show/16836/cadence-cereb...
Kangal - Sunday, November 7, 2021 - link
Snapdragon 888: 4x Cortex-A55 @ 1.80GHz 4x128KB pL2, with 4MB sL3, on Samsung5nm (5LPE)
Google Tensor: 4x Cortex-A55 @ 1.80GHz 4x128KB pL2, with 4MB sL3, on Samsung
5nm (5LPE)
Both of these SoC's are using Cortex-A55 cores which were licensed from ARM directly. They are off-the-shelf. These are not custom cores, such as the Mongoose, Early-Kyro, Krait, Denver, Carmel, or the 8-or-so different custom designs released by Apple. If you say that I am lying, then you are also saying that both Google, Qualcomm, are also lying. And note, that they are virtually identical in their specifications and build.
I think you entirely mis-understood the point of Cadence is about. Sure, even on the same chips there are variance, the so-called "silicon lottery". But be realistic, how much of a difference do you think it is? I'll give a hint, the larger the silicon, the more the variance, and the bigger the difference. If you check the latest data from the now bankrupt siliconlottery.com service, the difference with the 3950X is (worst) 4.00Ghz versus 4.15Ghz (best). At best that is a 3-point-something-percent difference, so let's say it is 5%... and this difference is likely to be less on smaller chips. But even if we accept 5%, that is nowhere near x2 variance.
Also, you would be calling AnandTech liars as well:
" the new Cortex-A77 picks up where the Cortex-A76 left off and follows Arm’s projected trajectory of delivering a continued SOLID PERFORMANCE UPLIFT of 20-25% CAGR "...
How is it that we are able to be impressed by a +20% uplift, yet, we completely disregard a +90% difference? It is not logical, and doesn't pass the sniff test. You can call me uneducated all you like, I'm trying to arrive at the truth, since there are big discrepancies with the data provided that I've pointed out to above. I am open to criticism, as everyone should be.
TellowKrinkle - Tuesday, November 9, 2021 - link
Let's look at some unitsPerformance is units of calculation work divided by time. For our graph, some constant times spec runs per second.
Performance per watt is then some constant times (spec runs) / (seconds * watts)
The joules measurement put up there is specifically joules per spec run. One joule is one watt second, so that number would therefore be (watts * seconds) / (spec runs).
Notice the similarity? Joules is 1/(perf per watt).
Hopefully it's clear from this that the "joules" measurement on that graph *is* there to indicate efficiency, just like a perf/watt measurement would be. The only difference is that in the joules graph, high numbers indicate inefficient processors, while in a perf/watt graph, those would be represented by low numbers.
The0ne - Thursday, November 4, 2021 - link
Pixel 4A updated last night to 12 and it runs even smoother. The UI tricks they have done does appear to make a visual difference. So far I'm impressed with 12 aside from the gigantic texts and bars here and there.